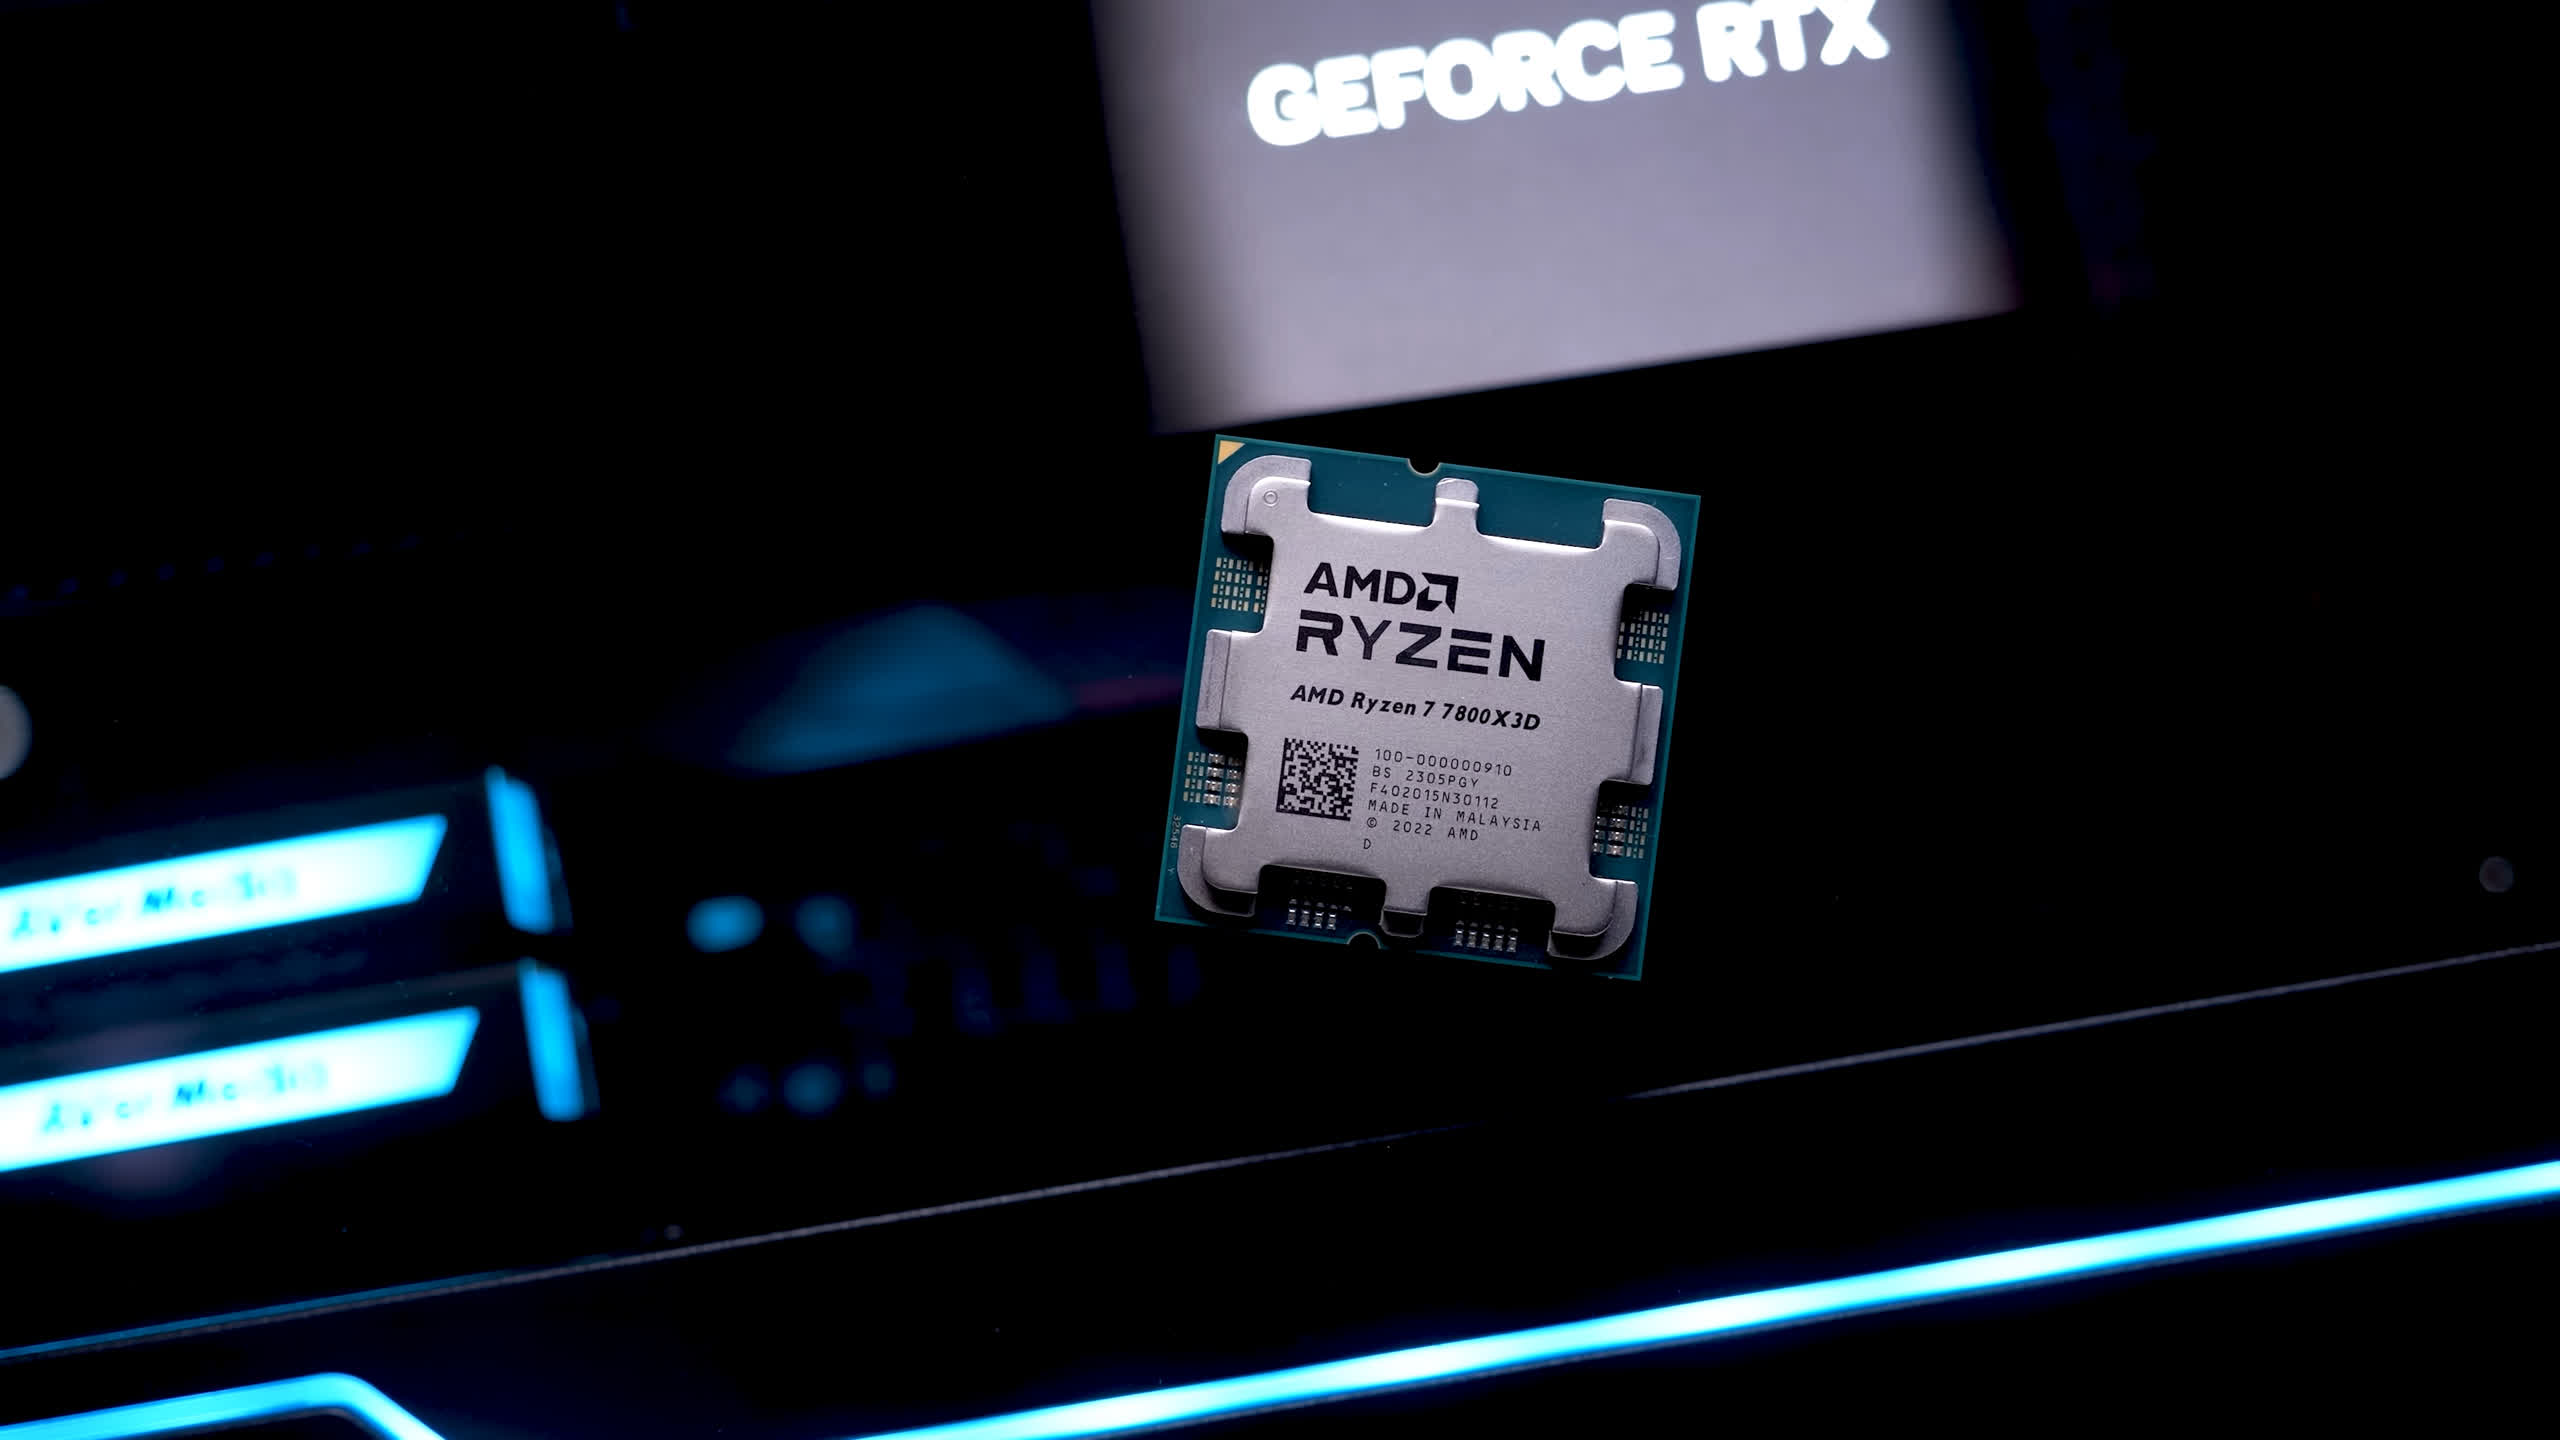
Today, we're comparing the new Ryzen 7 7800X3D head-to-head with the previous generation's 3D V-Cache part, the 5800X3D. The 5800X3D was a hugely successful CPU as it offered premium gaming performance at an affordable price, was power-efficient, and thus easy to cool. It wasn't reliant on premium memory for optimum performance and, best of all, it could be slotted into existing AM4 motherboards, making it an easy and affordable upgrade for many.
The question now is, for those still on AM4 and in need of more CPU power, should they purchase the 5800X3D, allowing them to breathe new life into their existing system, or start over with a new platform sporting a shiny new 7800X3D?
Then for those without an existing AM4 system looking at building a new PC, should they go with the more affordable option in the 5800X3D and its supporting platform, or go all out with the 7800X3D? Today's review plans to answer both of these questions and more.
For testing, the 5800X3D was used on the MSI MPG X570S Carbon Max WiFi motherboard with G.Skill's DDR4-3600 CL14 32GB memory. Meanwhile, the 7800X3D was installed on the Gigabyte X670E Aorus Master using the latest F11c BIOS revision. Then for the graphics card, we have the Asus ROG Strix RTX 4090 OC Edition graphics card, which has been benchmarked at 1080p, 1440p, and 4K. So let's get into it…
Benchmarks
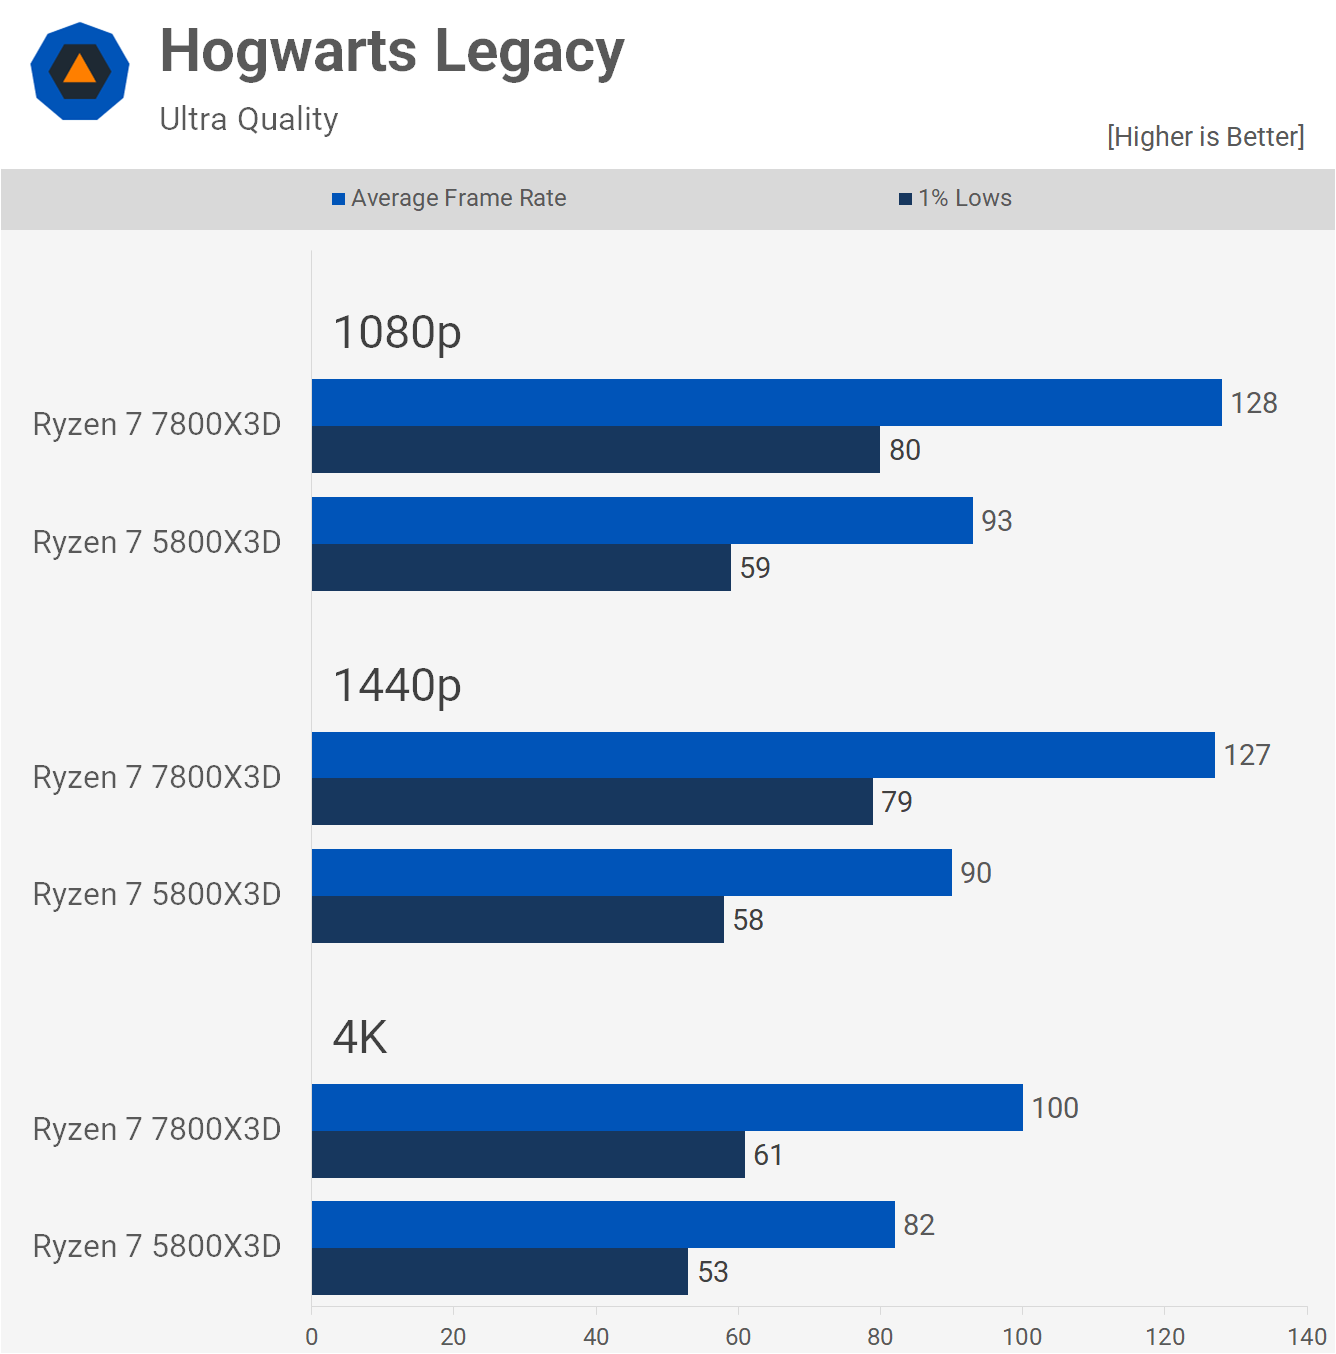
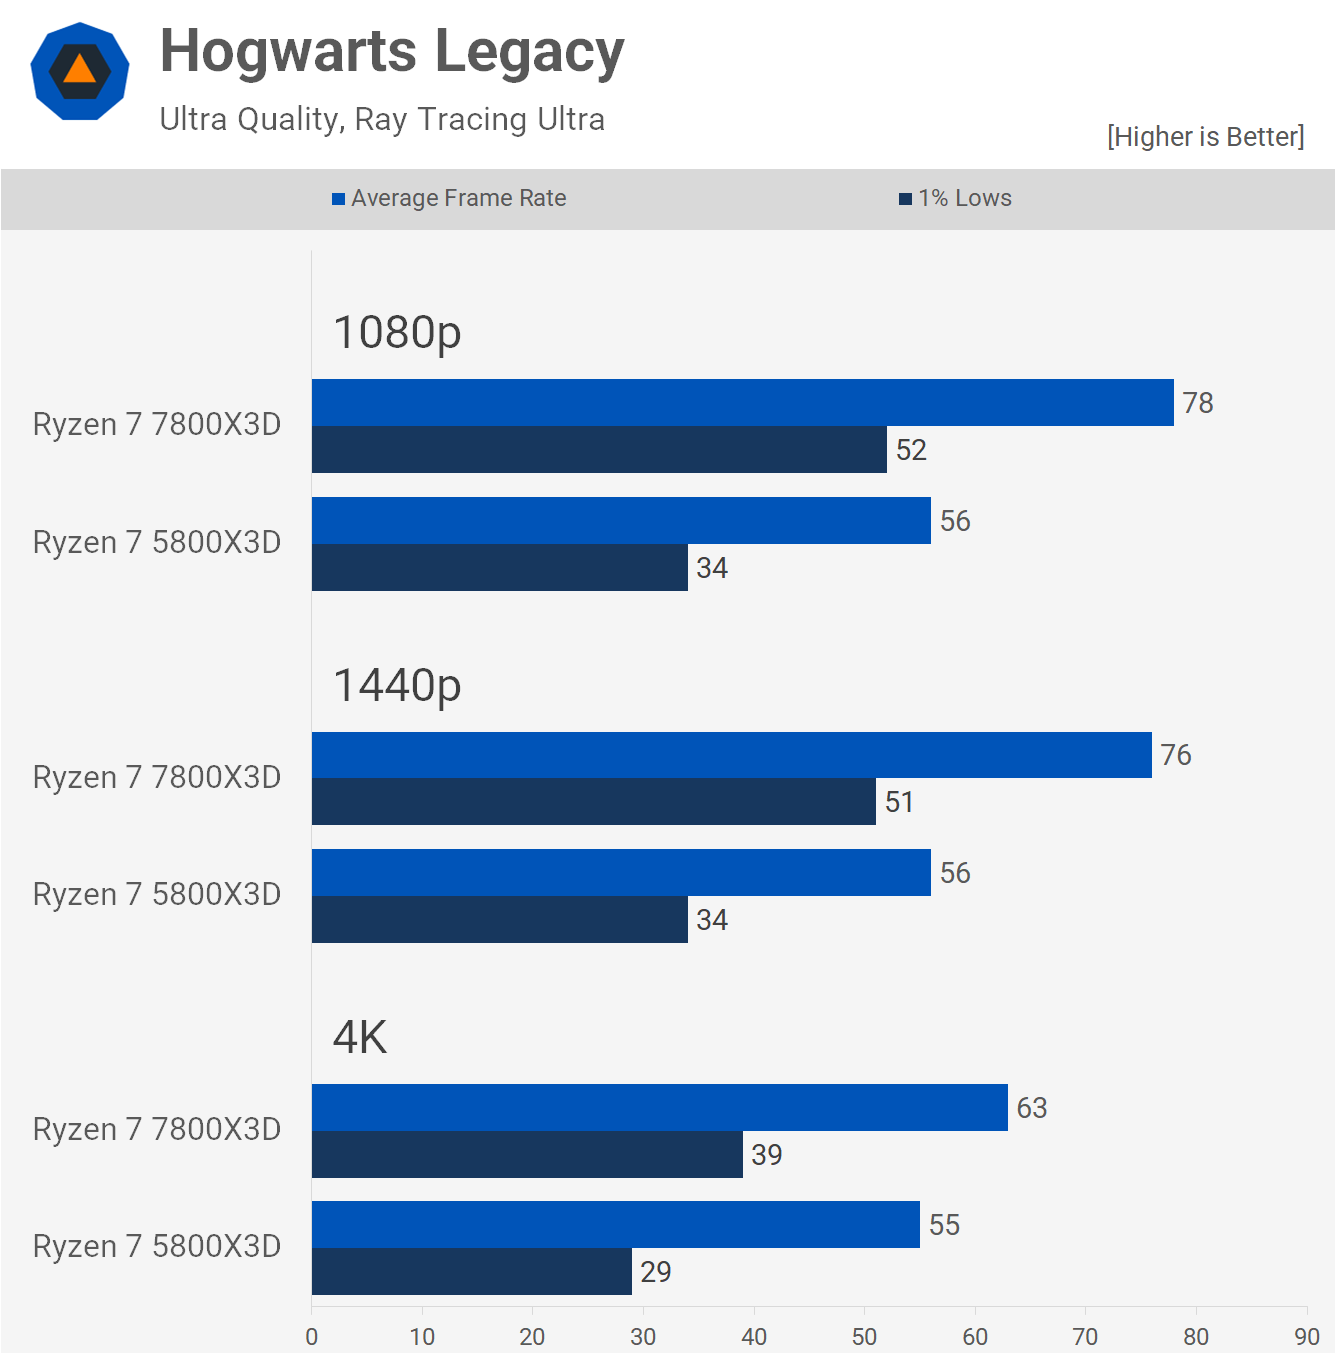
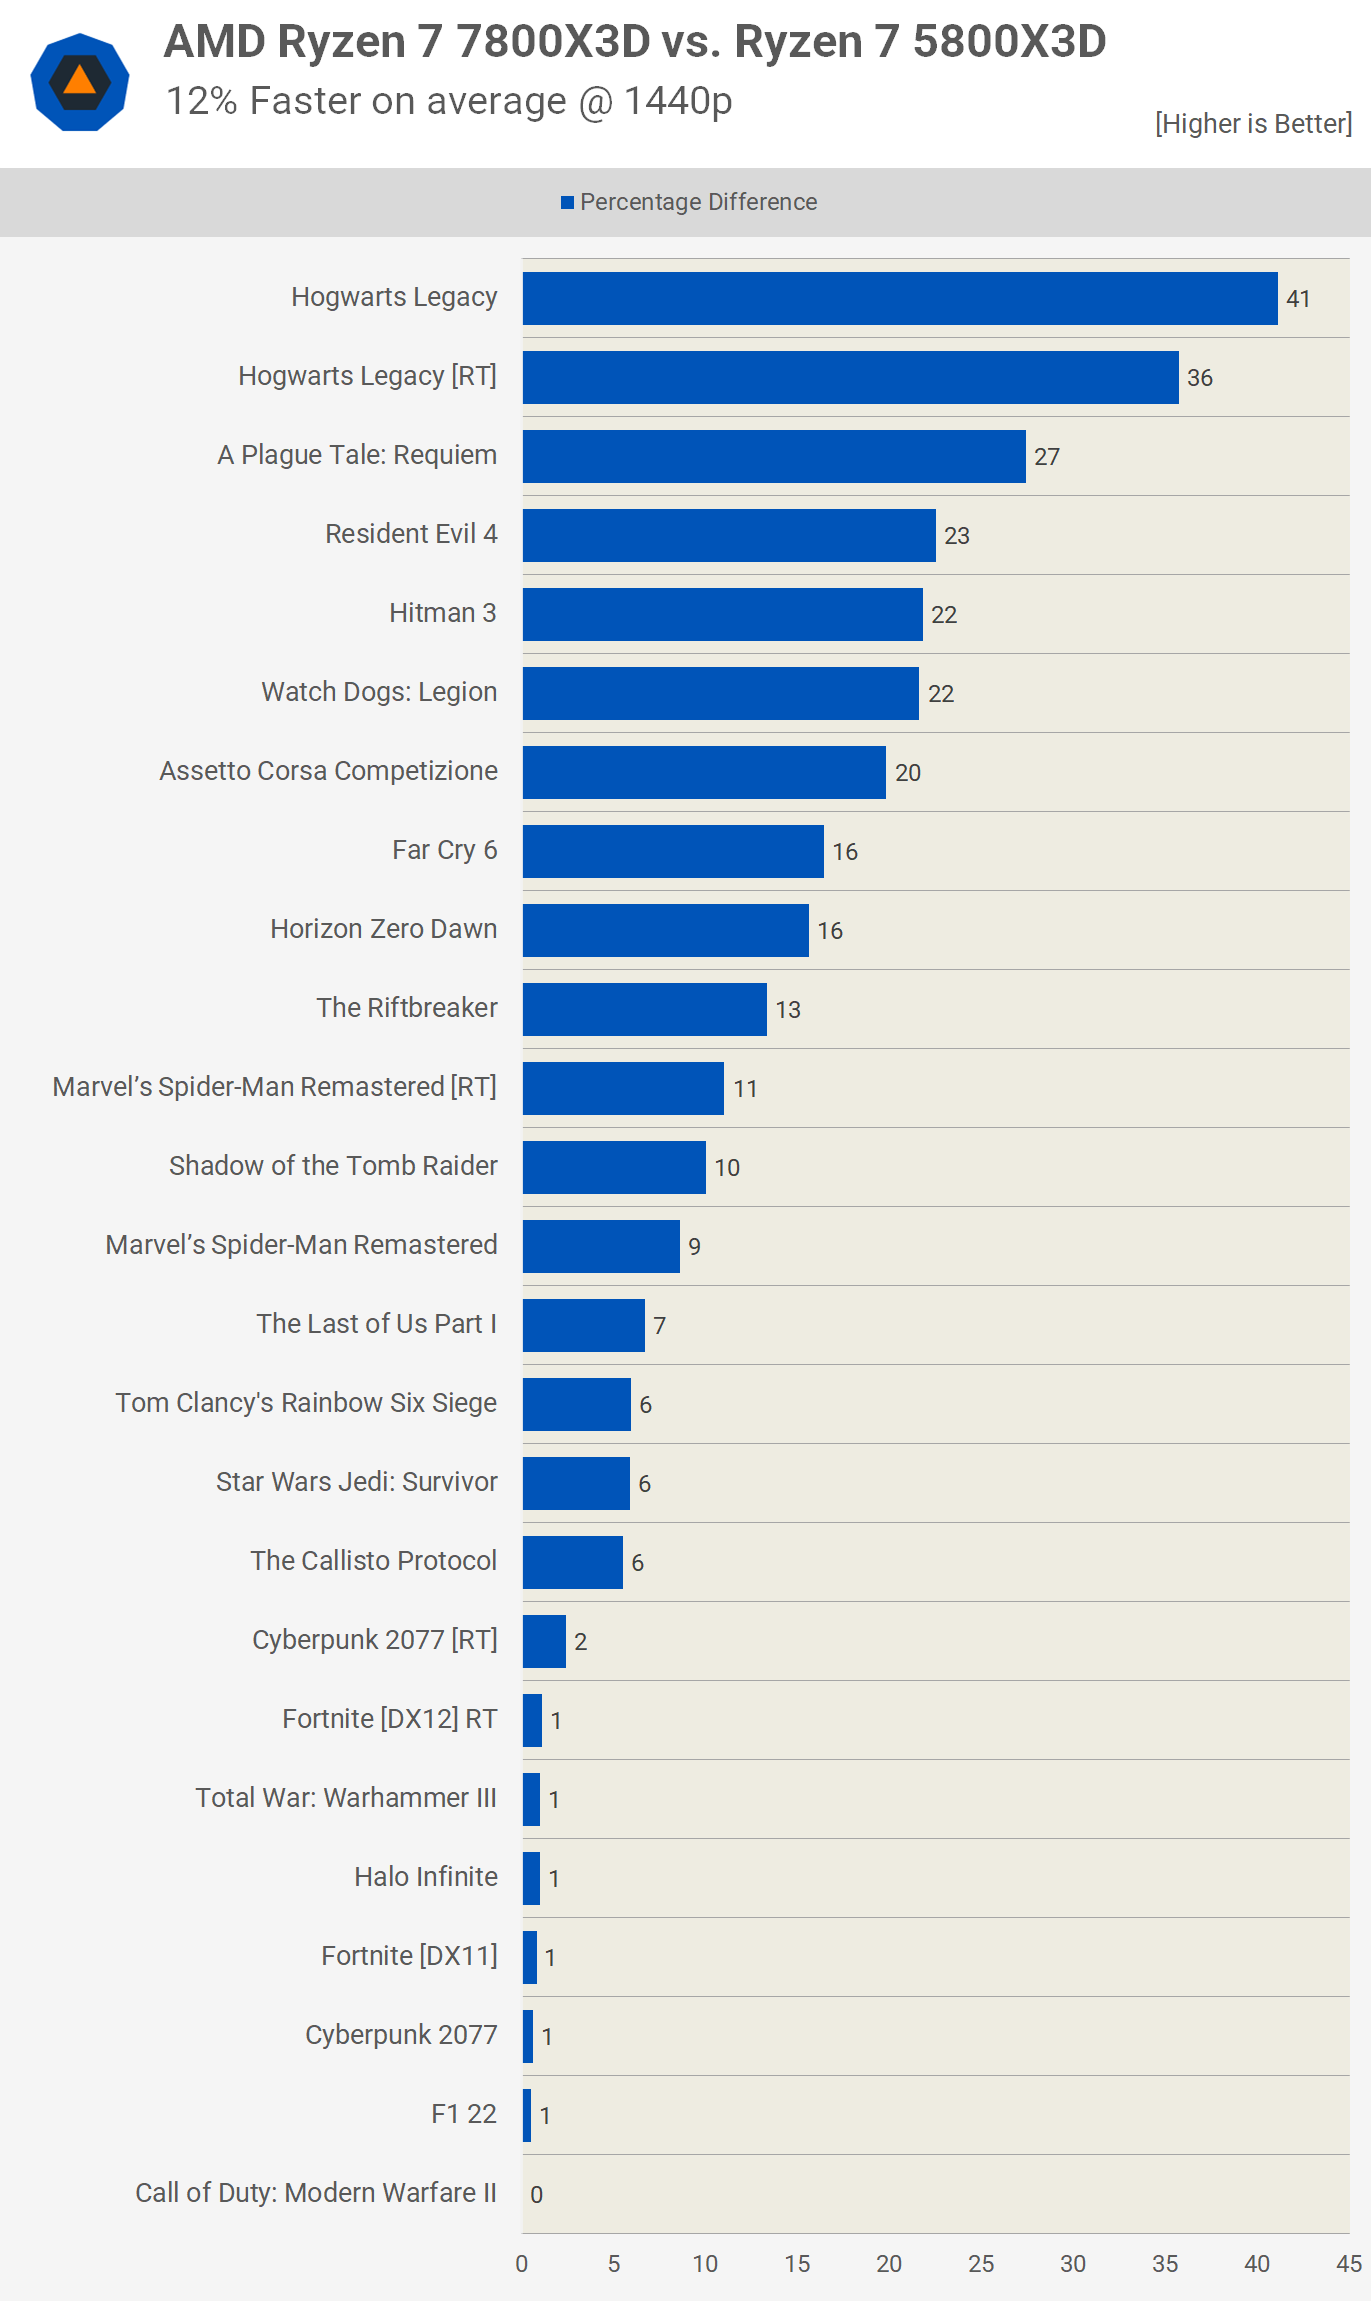
First up, we have Hogwarts Legacy using the ultra-quality preset, but with ray tracing disabled, though we will look at some RT results in a moment. Here, we find that the game is heavily CPU limited at both 1080p and 1440p, even with the 7800X3D. That said, the newer 3D V-cache CPU was 38-41% faster when comparing the average frame rate at these resolutions. The margin is reduced at 4K, but even so, the 7800X3D was still 2% faster here or 15% faster if we compare 1% lows.
Now with ray tracing enabled, the frame rates come well down, but whereas you might have expected performance to now be heavily GPU limited, that's not the case. The added CPU load required to run RT effects shows that the 7800X3D maintains its lead, delivering almost 40% more performance at 1080p and 36% more at 1440p.
Even at 4K, the newer 3D V-Cache part is offering a rather handy 15% performance advantage. So for those with higher-end GPUs hoping to play Hogwarts Legacy with ray tracing enabled, the 7800X3D will offer a noticeable performance boost over the 5800X3D in this title.
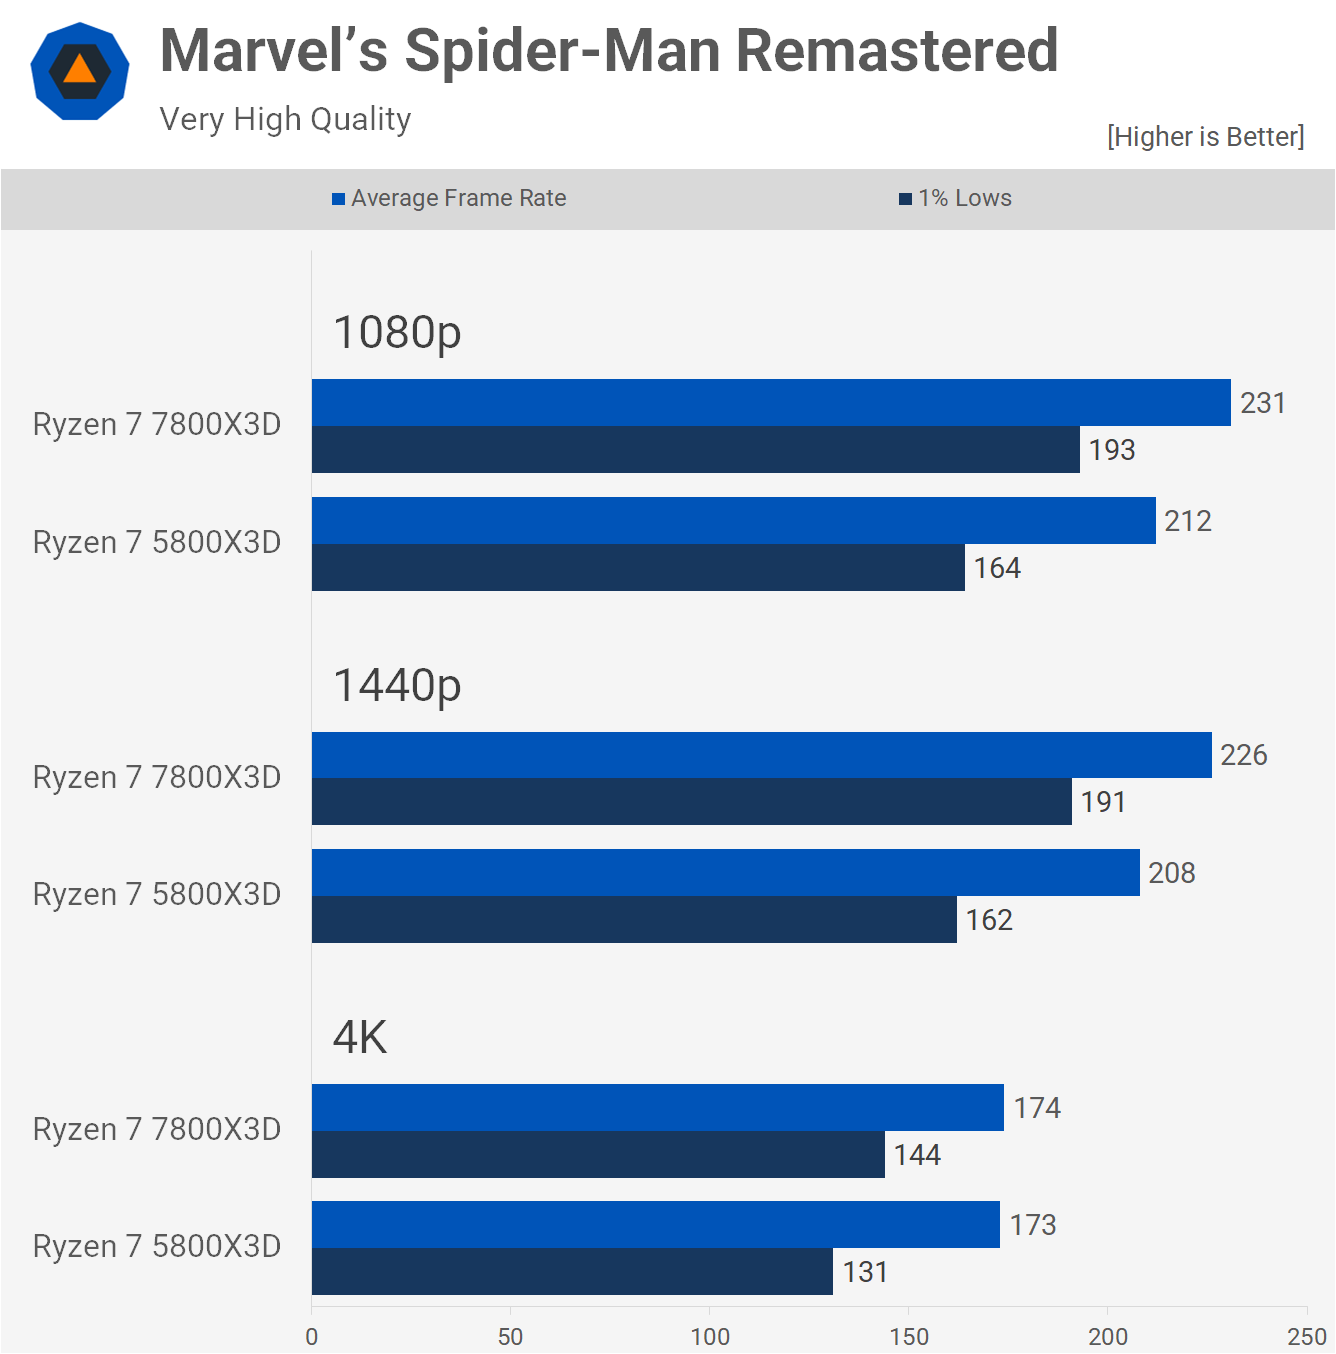
Next, we have Marvel's Spider-Man Remastered, and this game plays very well using either CPU, with well over 200 fps on average at 1080p and 1440p, regardless of the CPU used. The 7800X3D was just 9% faster at 1080p and 1440p, with virtually identical performance at 4K.
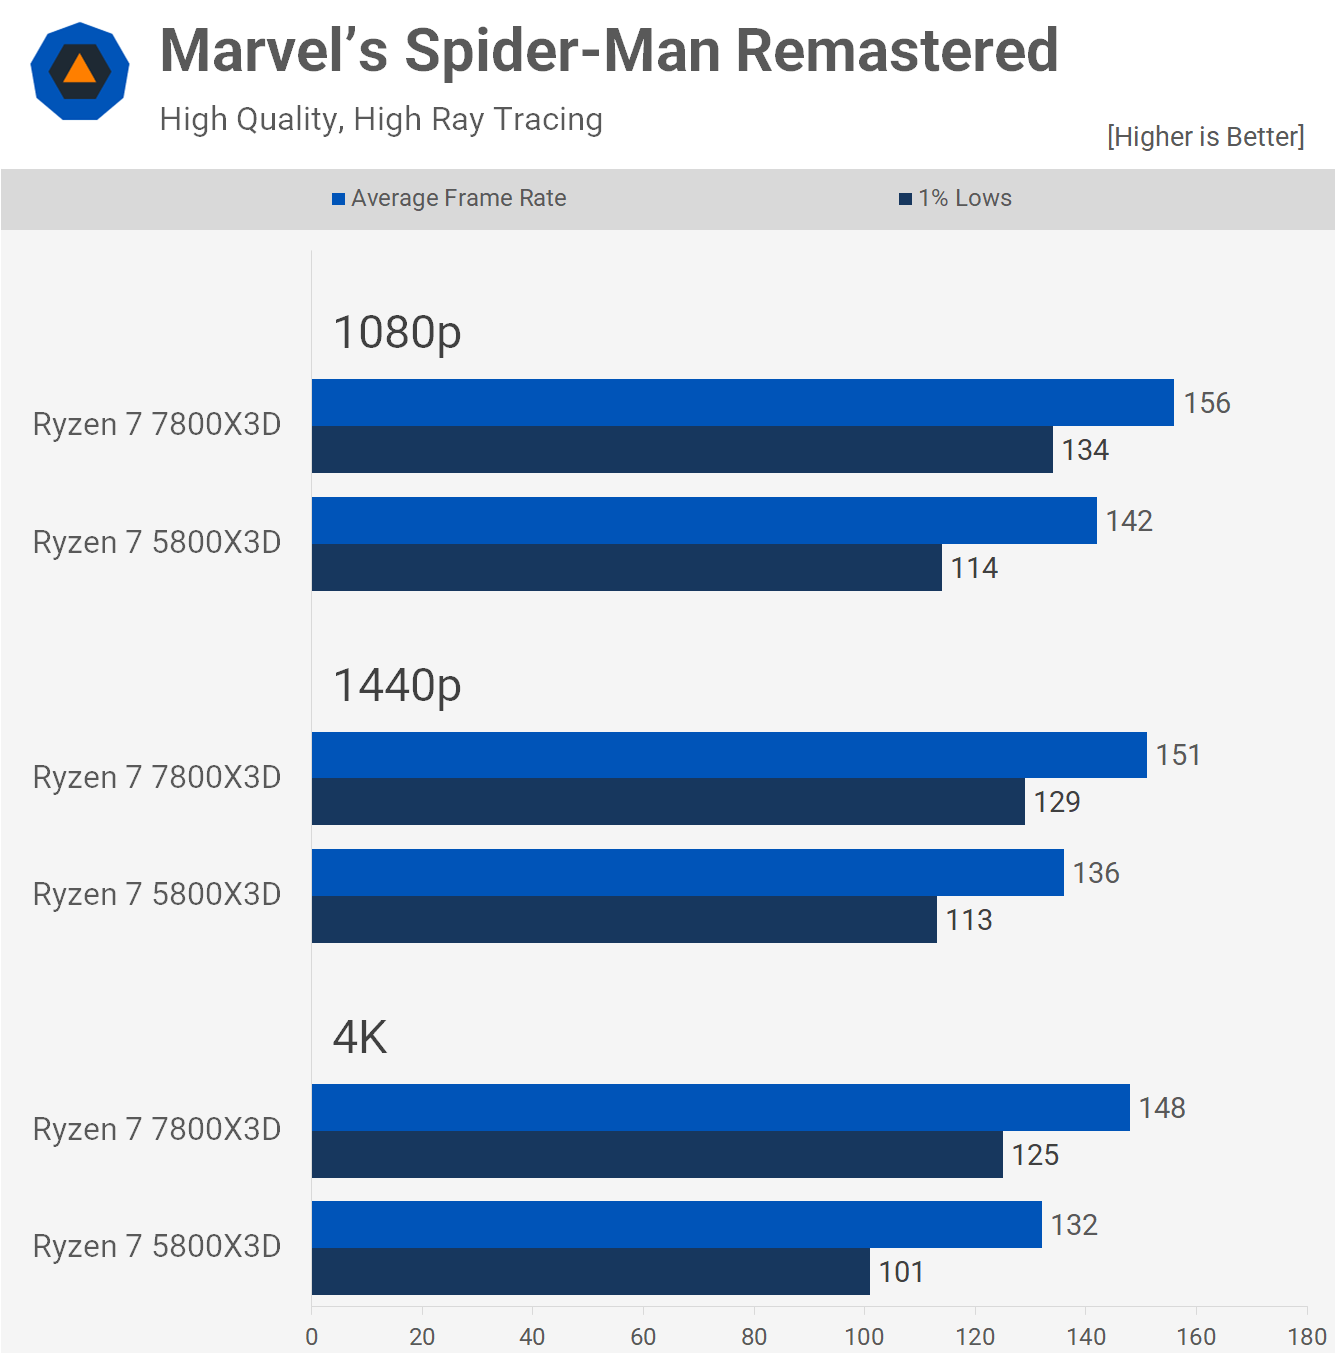
As expected, enabling ray tracing did reduce frame rates, but the margins between these two AMD CPUs remained similar, with the 7800X3D outperforming by a 10% margin at 1080p, 11% at 1440p and surprisingly 12% at 4K with a massive 24% improvement for the 1% lows here.
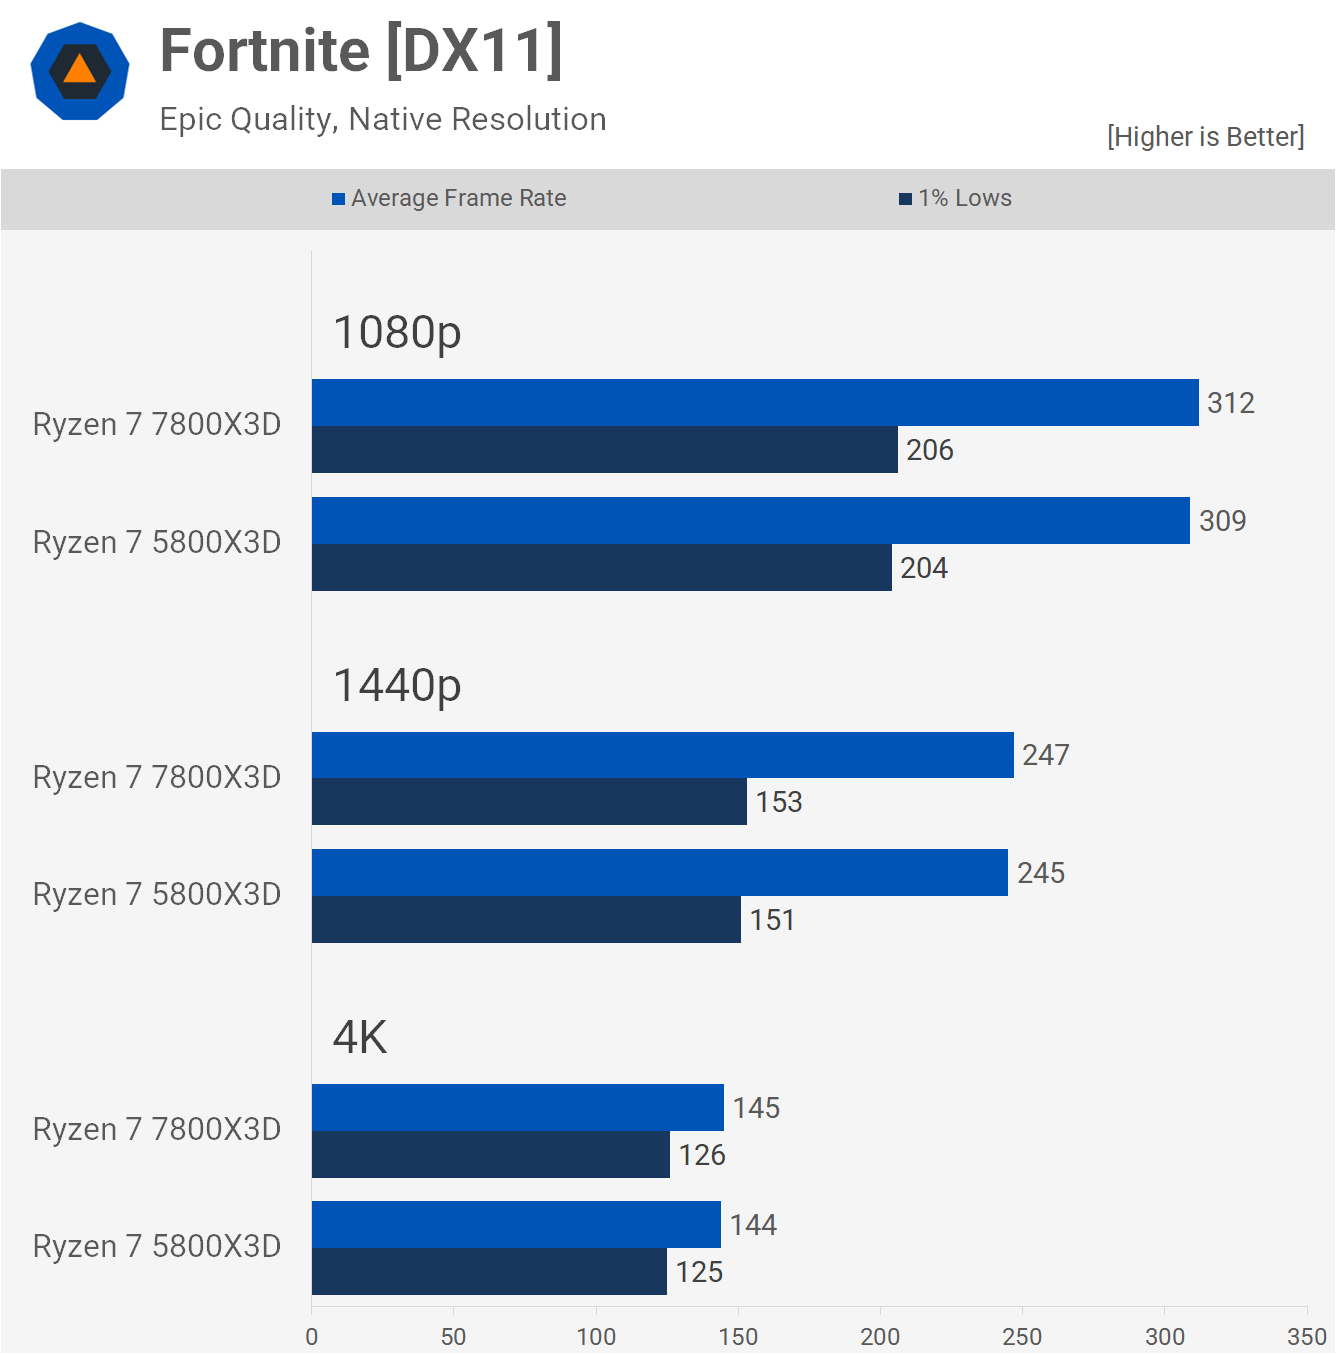
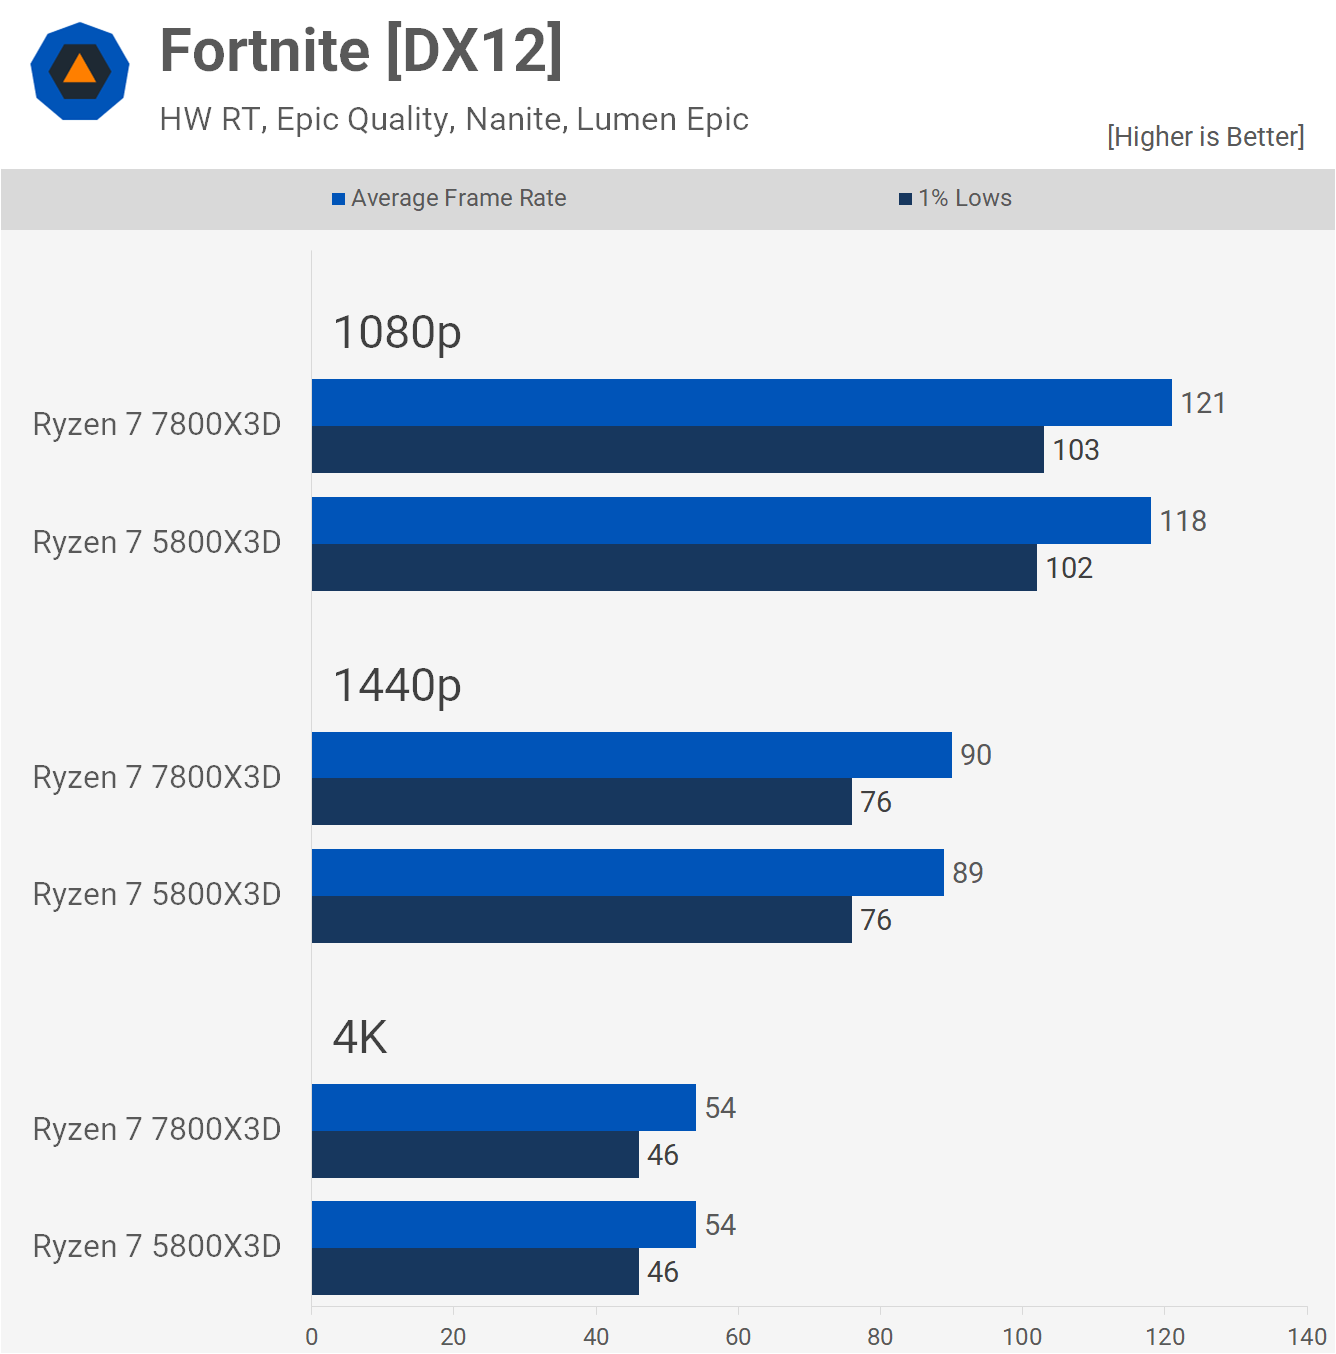
Moving on to Fortnite, which we tested using the epic quality settings (although this probably isn't how competitive gamers will play the game). Regardless, this allowed for over 300 fps at 1080p, and both the 5800X3D and 7800X3D produced virtually identical results.
Even with hardware ray tracing enabled, CPU performance remained very similar with no noticeable difference between these two 3D V-Cache parts.
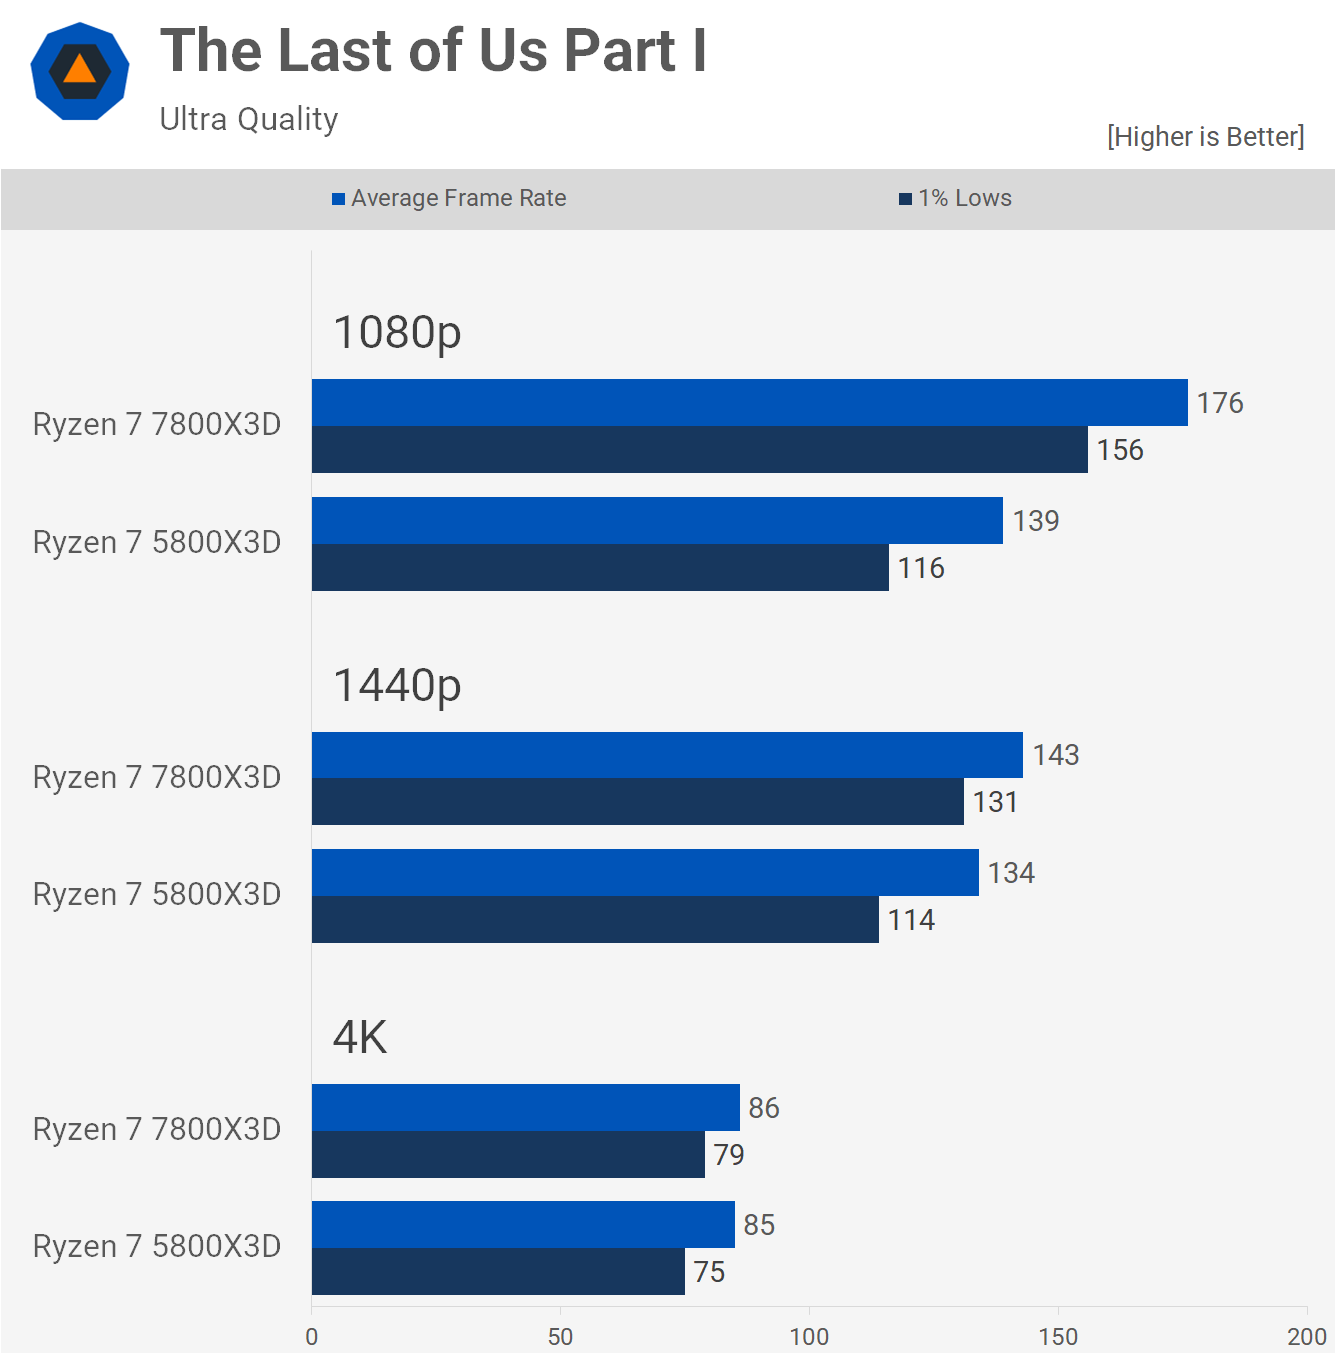
This wasn't the case in The Last of Us Part I, where the 7800X3D was 27% faster than the 5800X3D at 1080p, although it must be said that both CPUs delivered highly playable performance. The margin was reduced to just 7% at 1440p or 15% when looking at the 1% lows, but the performance here is quite similar overall, with little to no performance difference at 4K.
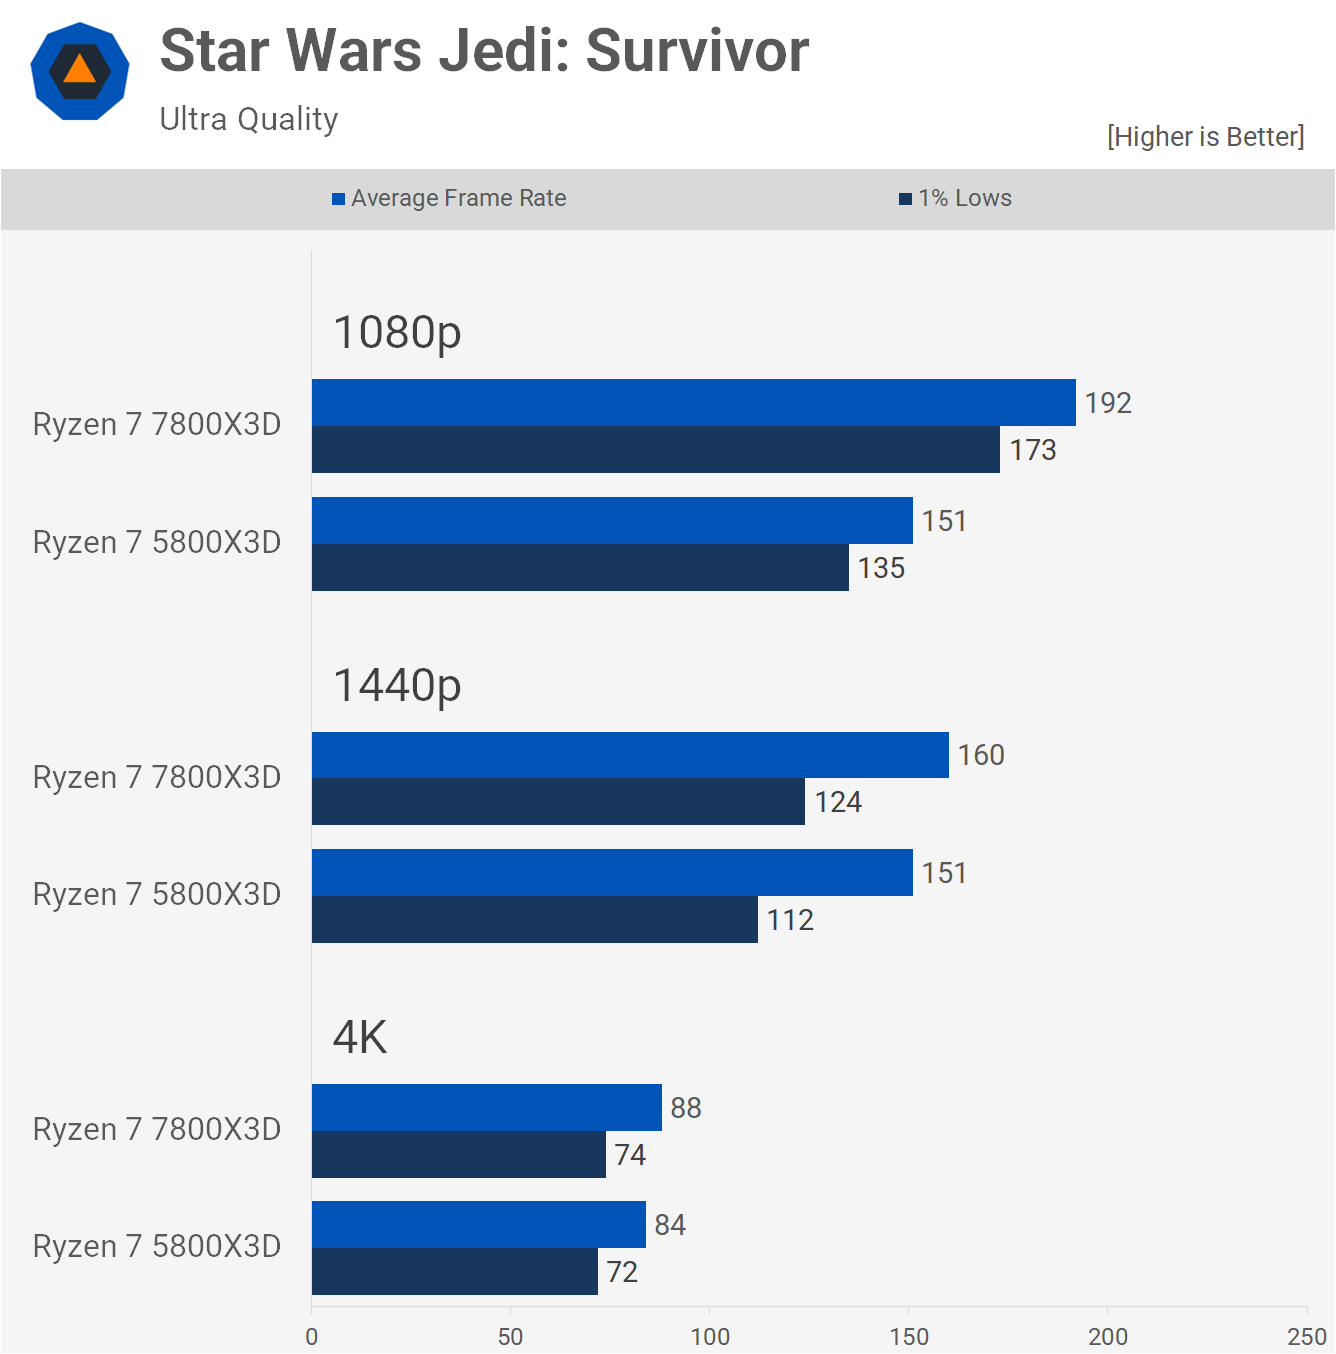
Star Wars Jedi: Survivor is a famously CPU-limited title, but it has seen a few patches since release and we tested with the latest version of the game. Both CPUs allowed for impressive frame rates at 1080p, but the 7800X3D was 27% faster averaging 192 fps. However, this margin was reduced to just 6% at the more GPU-limited 1440p resolution, and then essentially nothing at 4K.
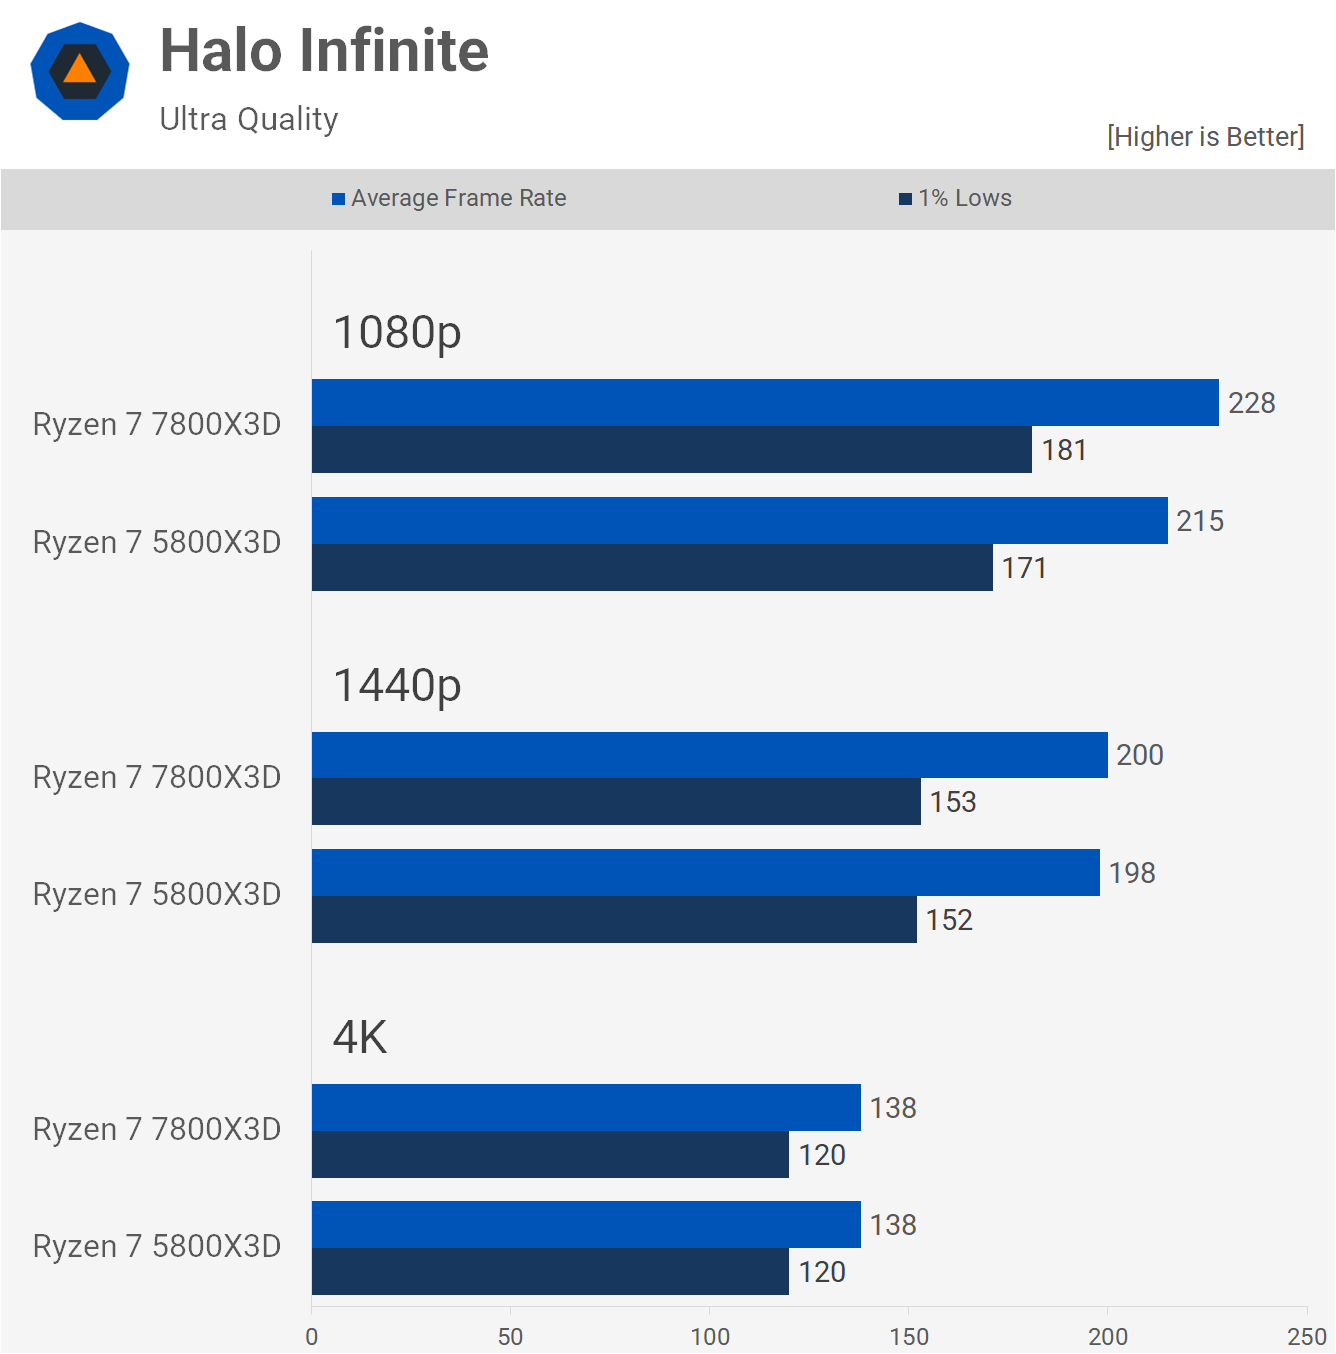
Moving on to Halo Infinite, we find that either CPU is more than capable of powering the RTX 4090 through this title, with over 200 fps seen at 1080p and around 200 fps at 1440p.
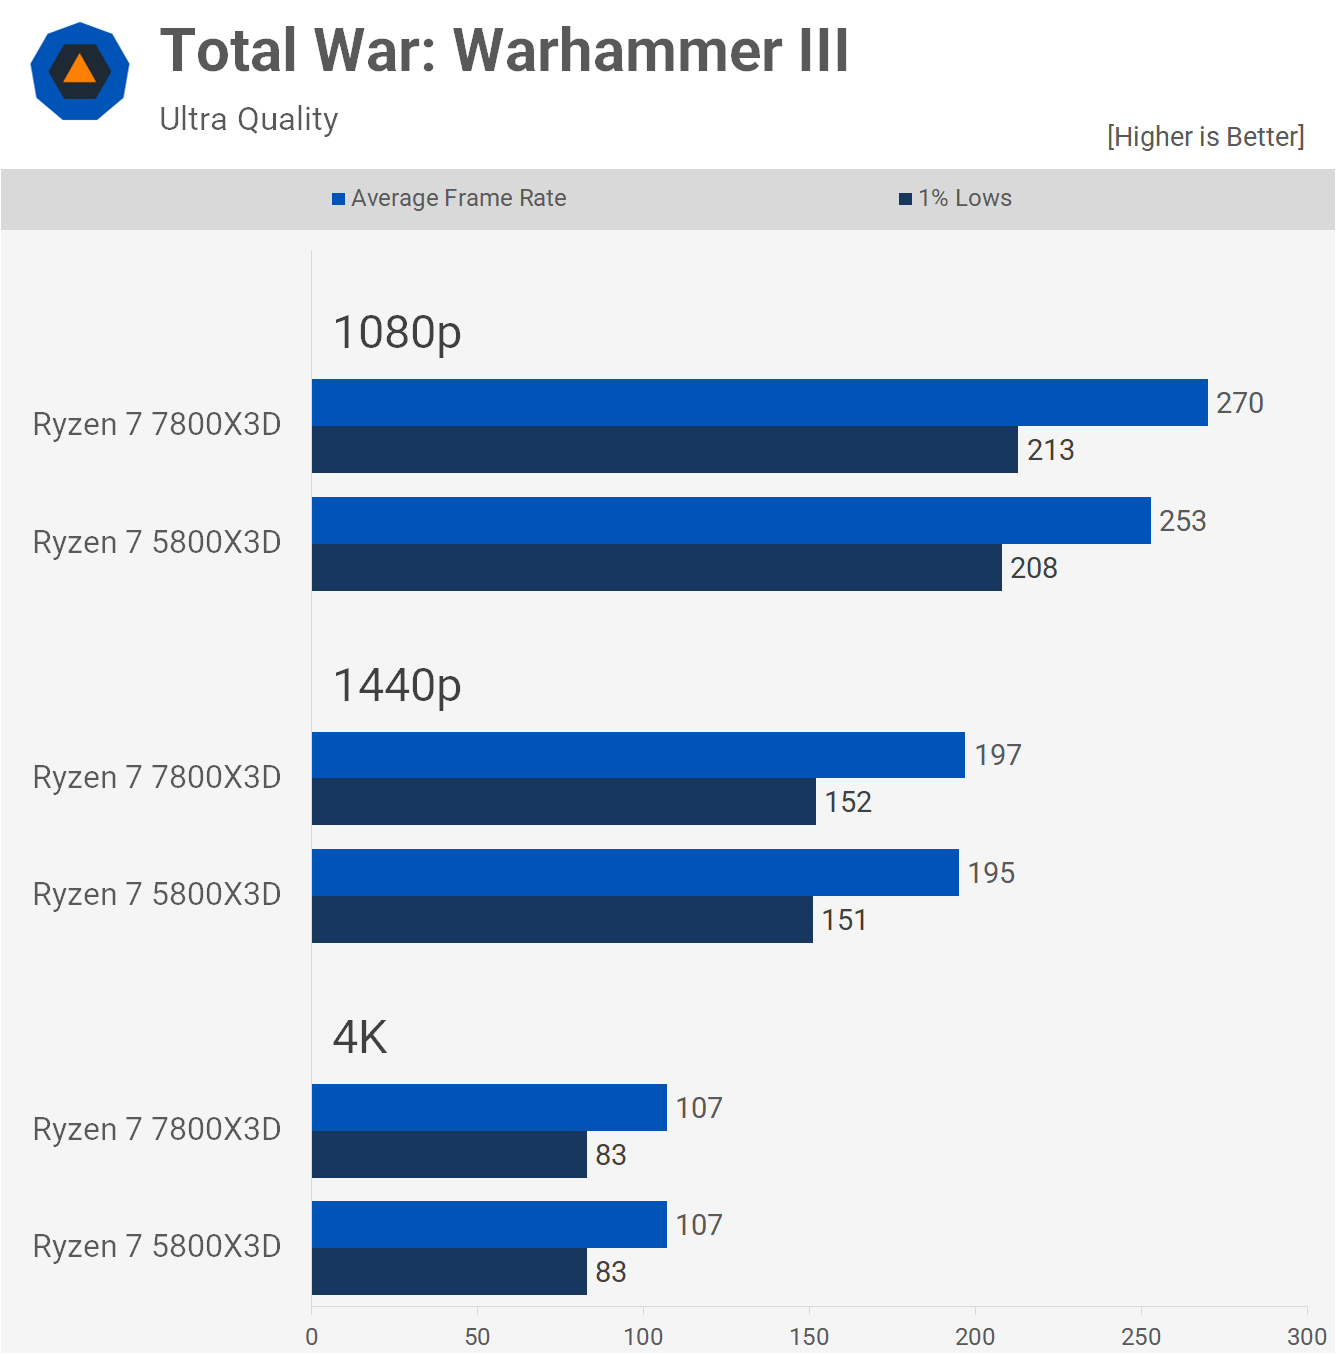
The performance in Total War: Warhammer III is also much the same using either CPU. The 7800X3D managed a small 7% win at 1080p, but the 1440p and 4K results were basically identical.
F1 22 is another game that sees mostly comparable performance; for example, the 1440p and 4K numbers are extremely similar, and in some instances, such as 4K, they're the same. But at 1080p, the 7800X3D was 22% faster when comparing the average frame rate and 31% faster for the 1% lows. How much this matters at over 200 fps will be for you to decide, at least for this particular title, but it does indicate that when more CPU limited, the 7800X3D can boost gaming performance quite dramatically.
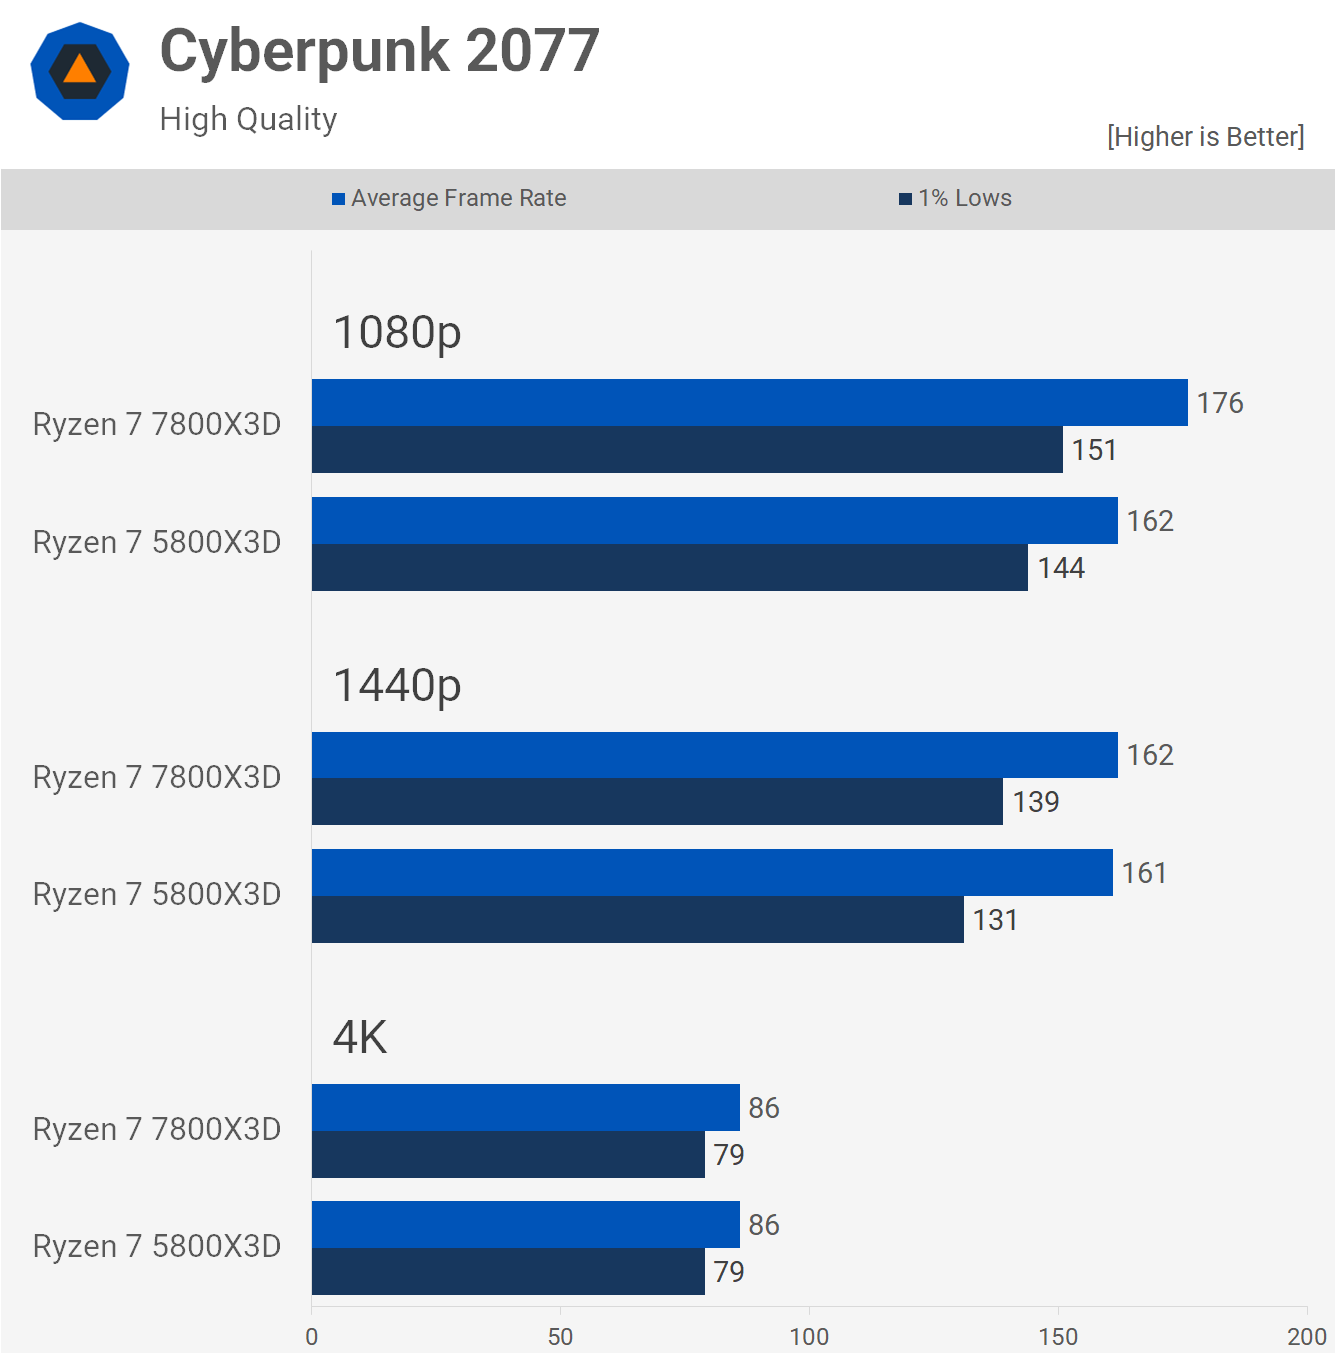
Using the high-quality preset, Cyberpunk 2077 appears to be mostly GPU limited, even with the RTX 4090. The 7800X3D offered a small 9% performance bump at 1080p, but apart from that, the two CPUs were very similar.
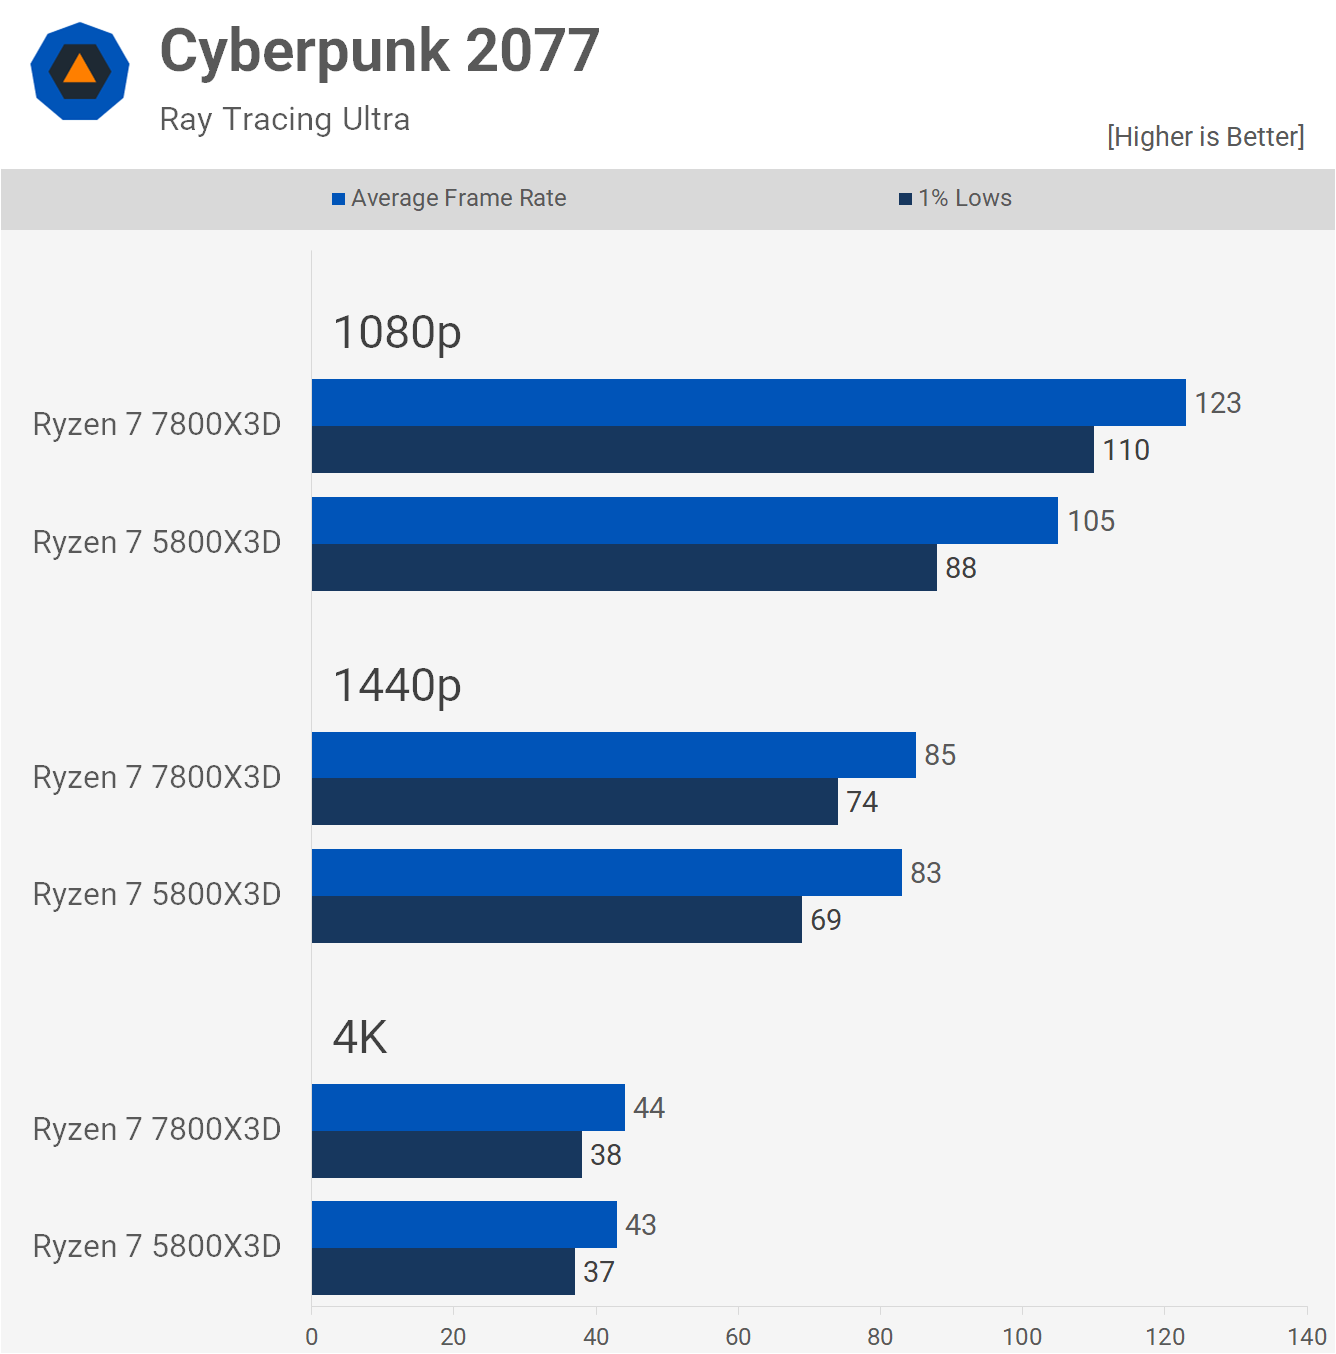
Enabling ray tracing did increase CPU demand, and as a result, the 7800X3D was able to extend its lead over the 5800X3D to 17% at 1080p, although the 1440p and 4K margins remained much the same, suggesting that performance here was virtually identical.
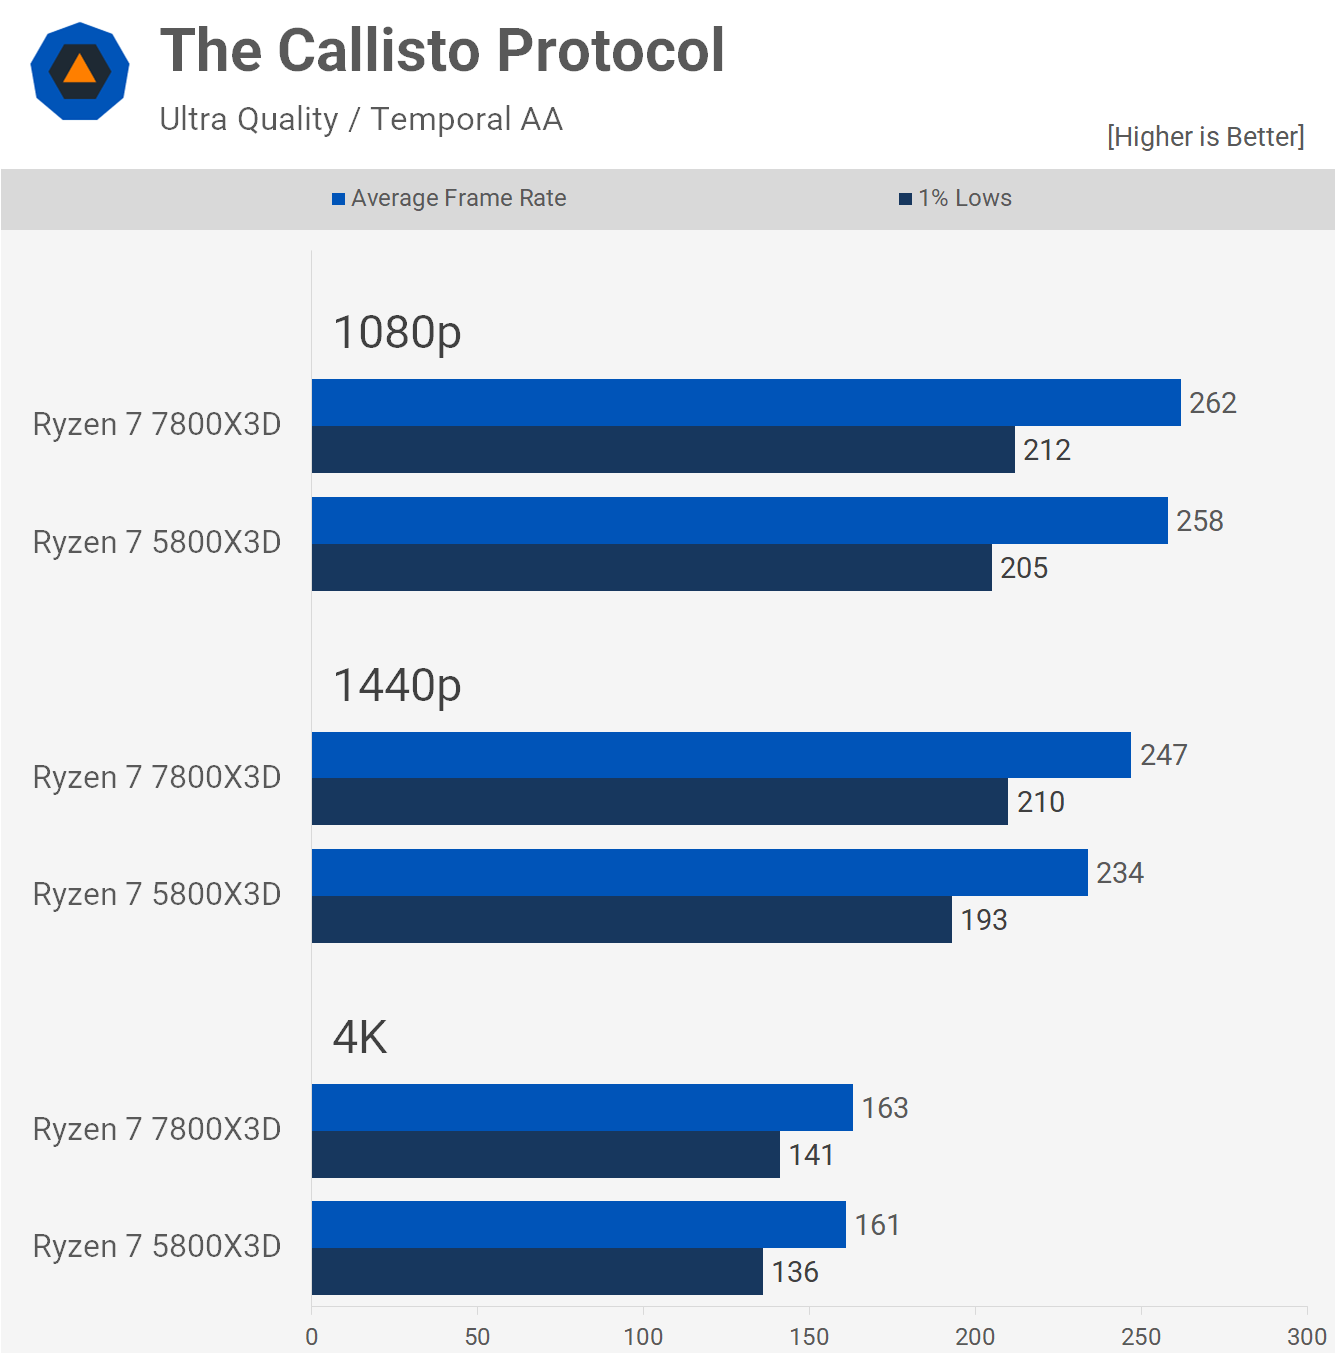
The Callisto Protocol isn't the most CPU-demanding game we currently test with, so like Fortnite, Halo, and Warhammer III, the 5800X3D and 7800X3D are very similar in this title with only single-digit margins seen.
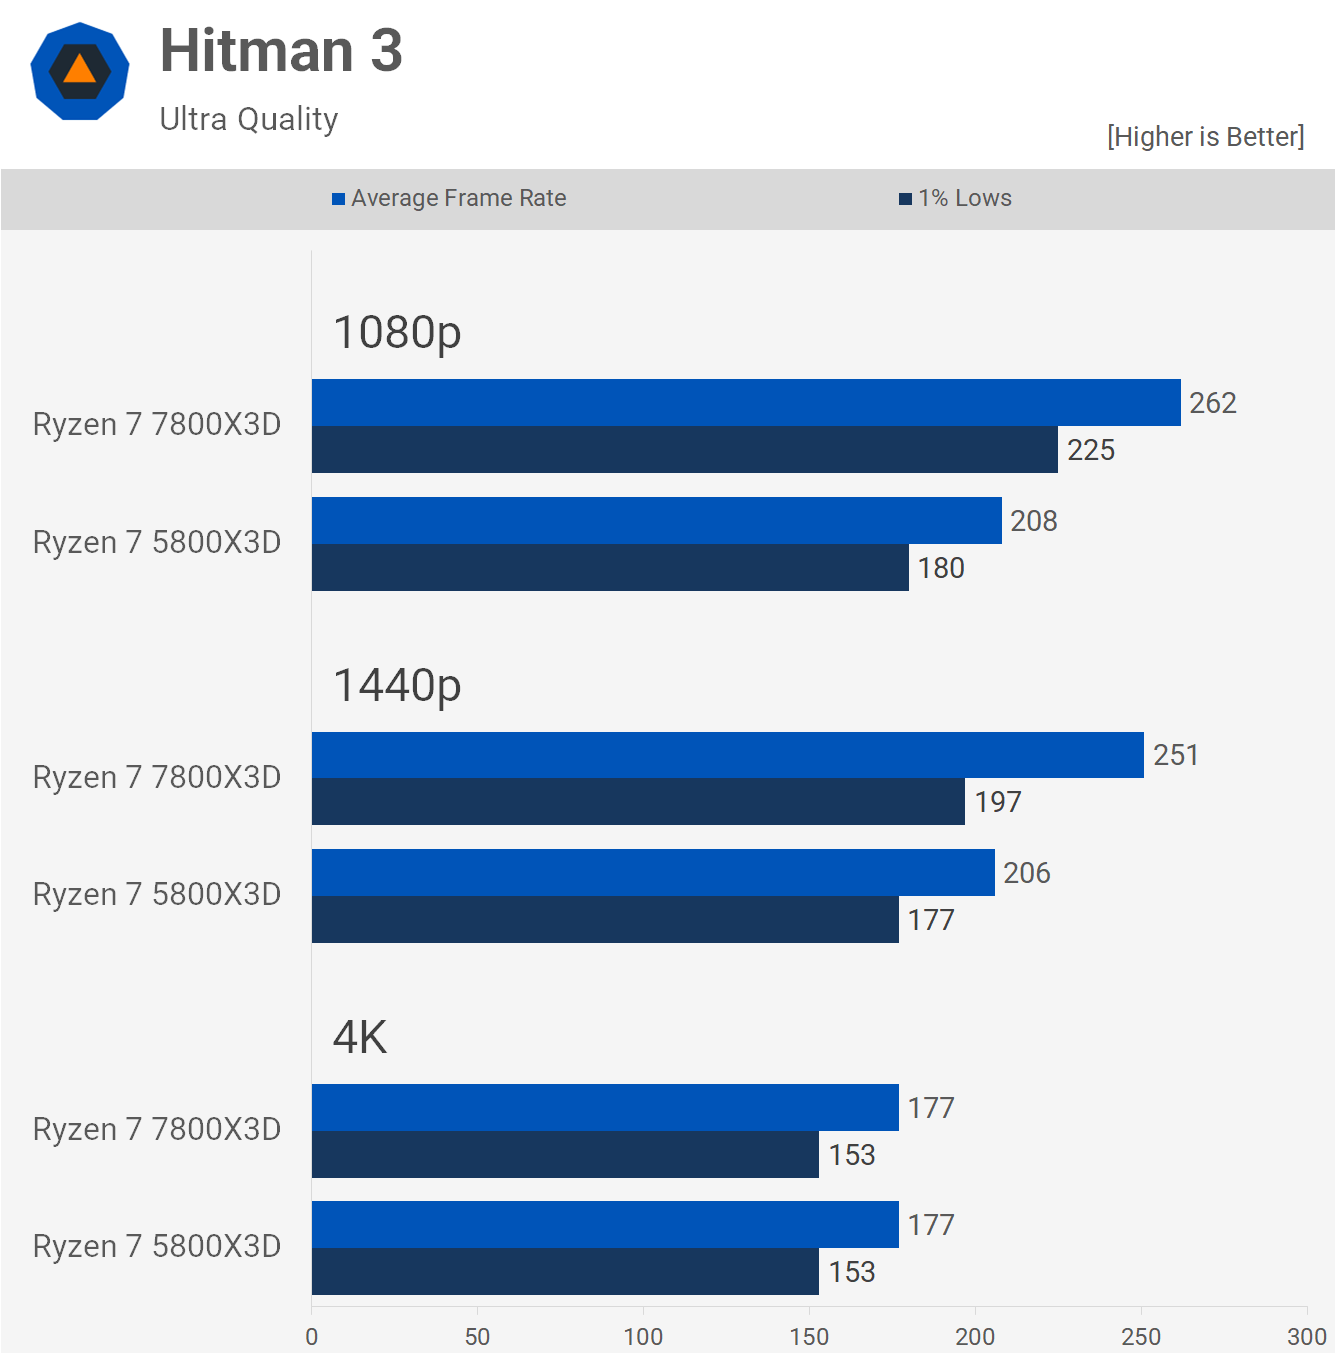
The 5800X3D powered through Hitman 3 with 208 fps on average, though the 7800X3D was still 26% faster, rendering 262 fps. Similar margins were also seen at 1440p before the results became entirely GPU-limited at 4K with 177 fps each.
Far Cry 6 is a game that can probably be comfortably played at 183 fps, but if not, the 7800X3D should suffice with 237 fps, a 30% increase. That margin drops to 16% at 1440p and then to just 6% at 4K.
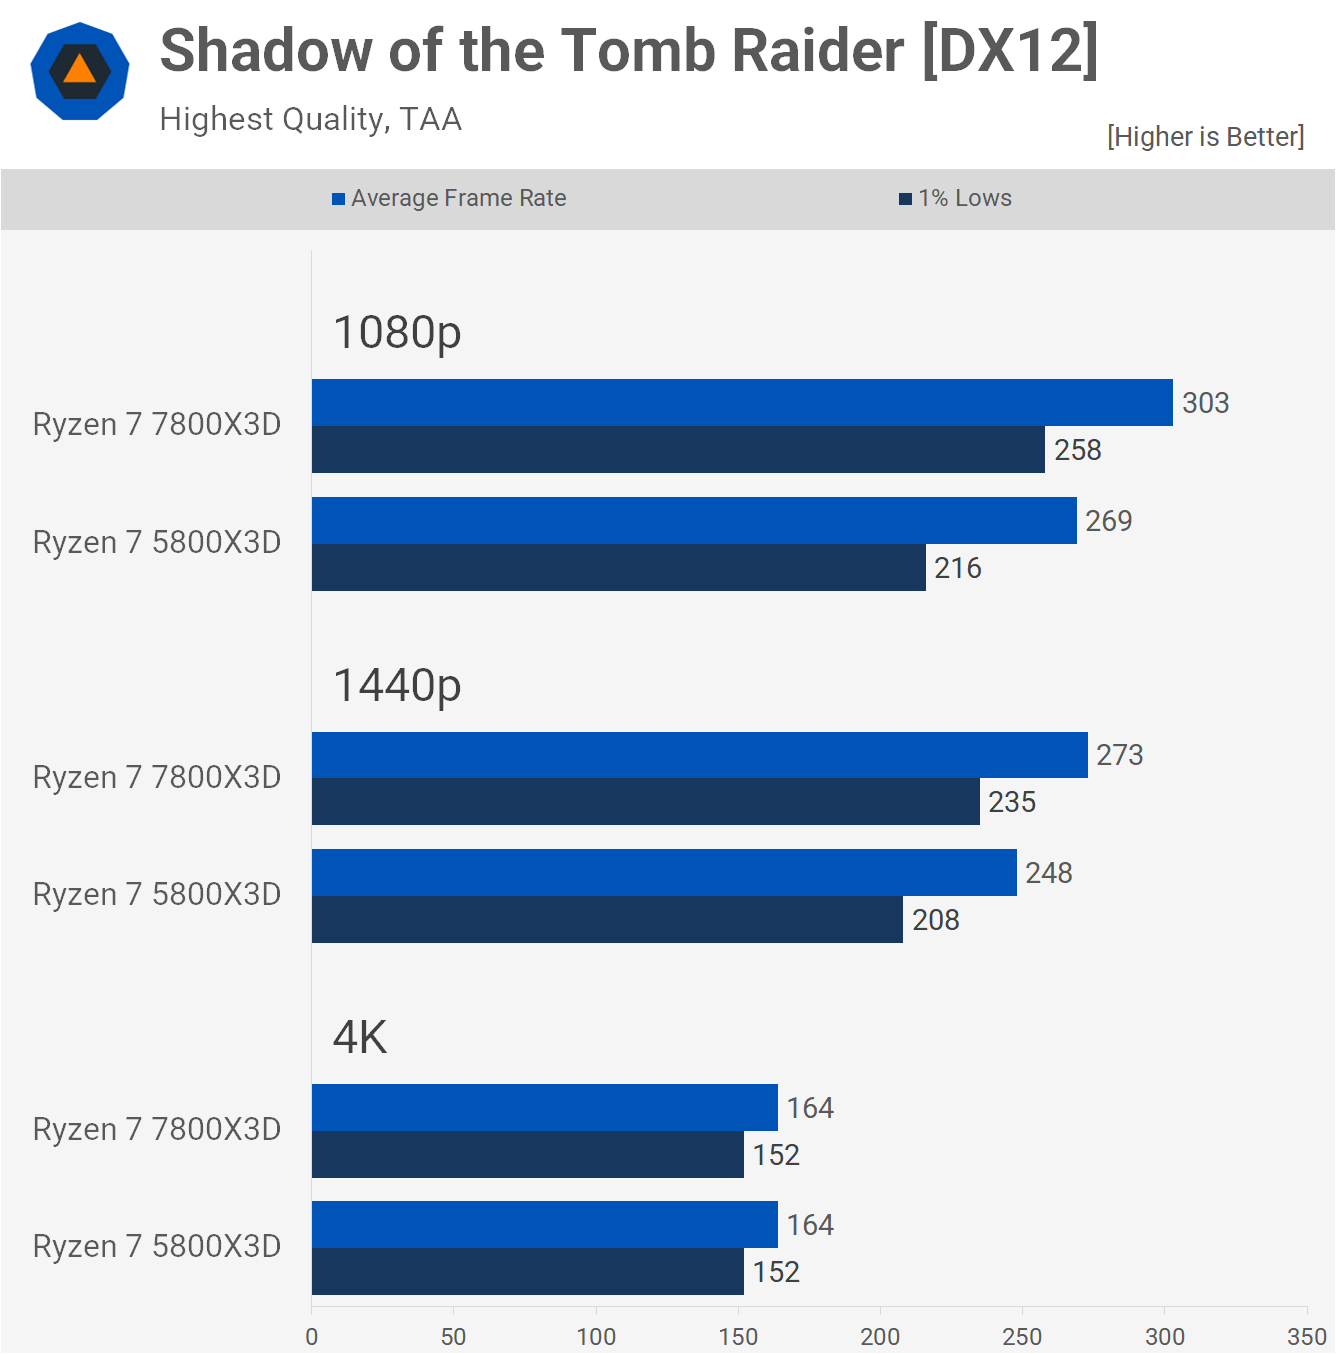
Of course, Shadow of the Tomb Raider has been included, and the 5800X3D managed an average of 269 fps at 1080p. This saw the 7800X3D improve performance by just 13% to 303 fps. That margin was then reduced to 10% at 1440p and entirely eliminated at 4K.
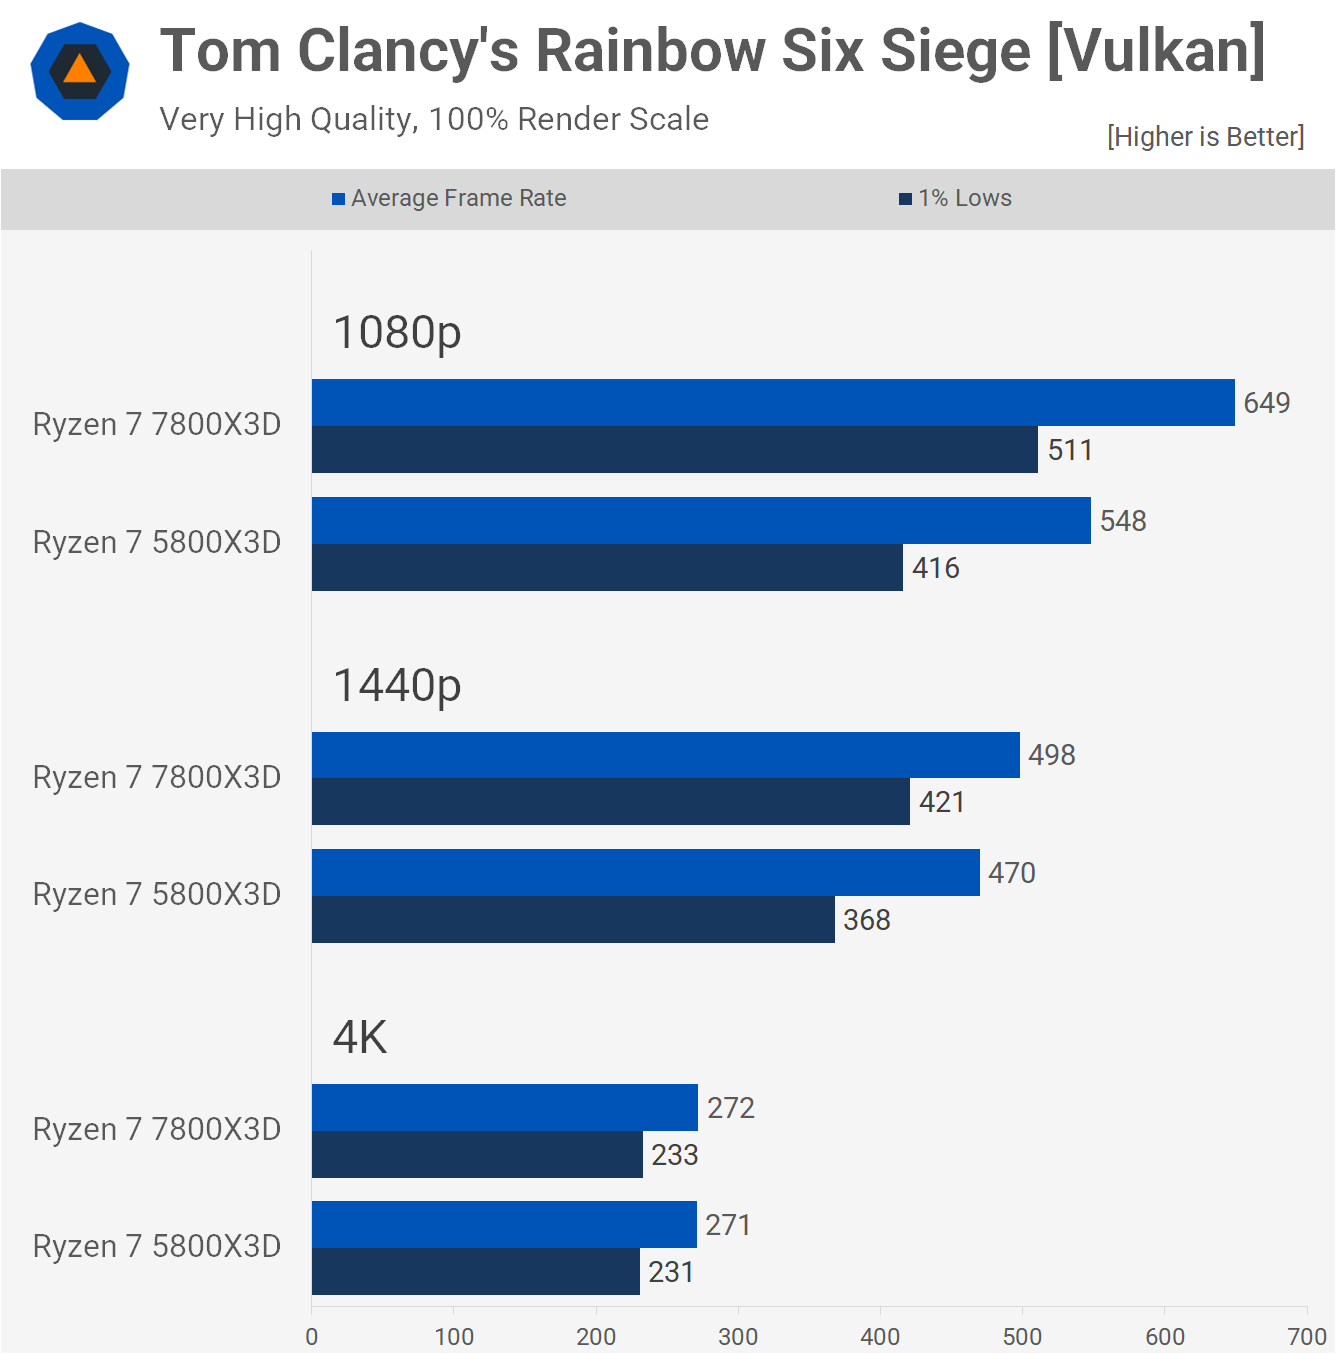
For those who find 548 fps to be exactly 101 fewer frames per second than desired, we have good news: the 7800X3D achieves 649 fps when paired with an RTX 4090 at 1080p using the very high-quality preset. That's an 18% increase for those keeping count; the significance of this in practice is difficult to quantify, but there it is.
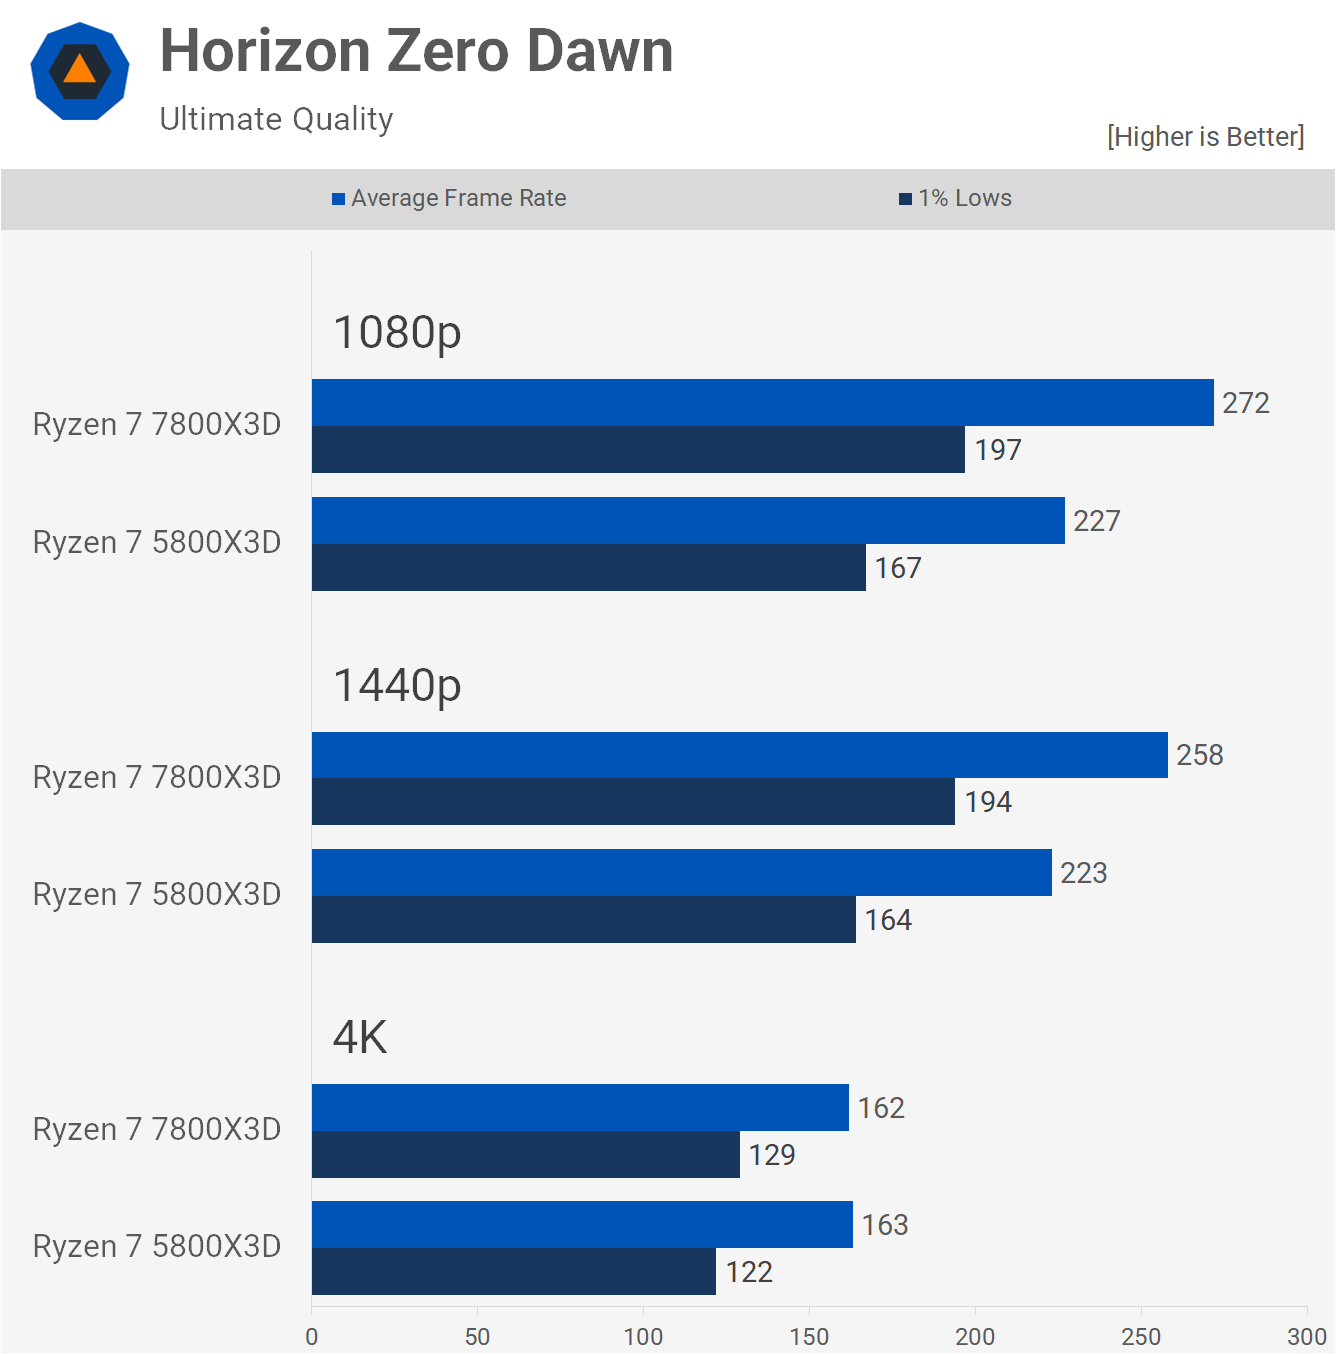
The 5800X3D managed 227 fps in Horizon Zero Dawn at 1080p, but the 7800X3D was still 20% faster hitting 272 fps. The 1440p margins were much the same, and again it's not until we hit 4K that the results are much the same.
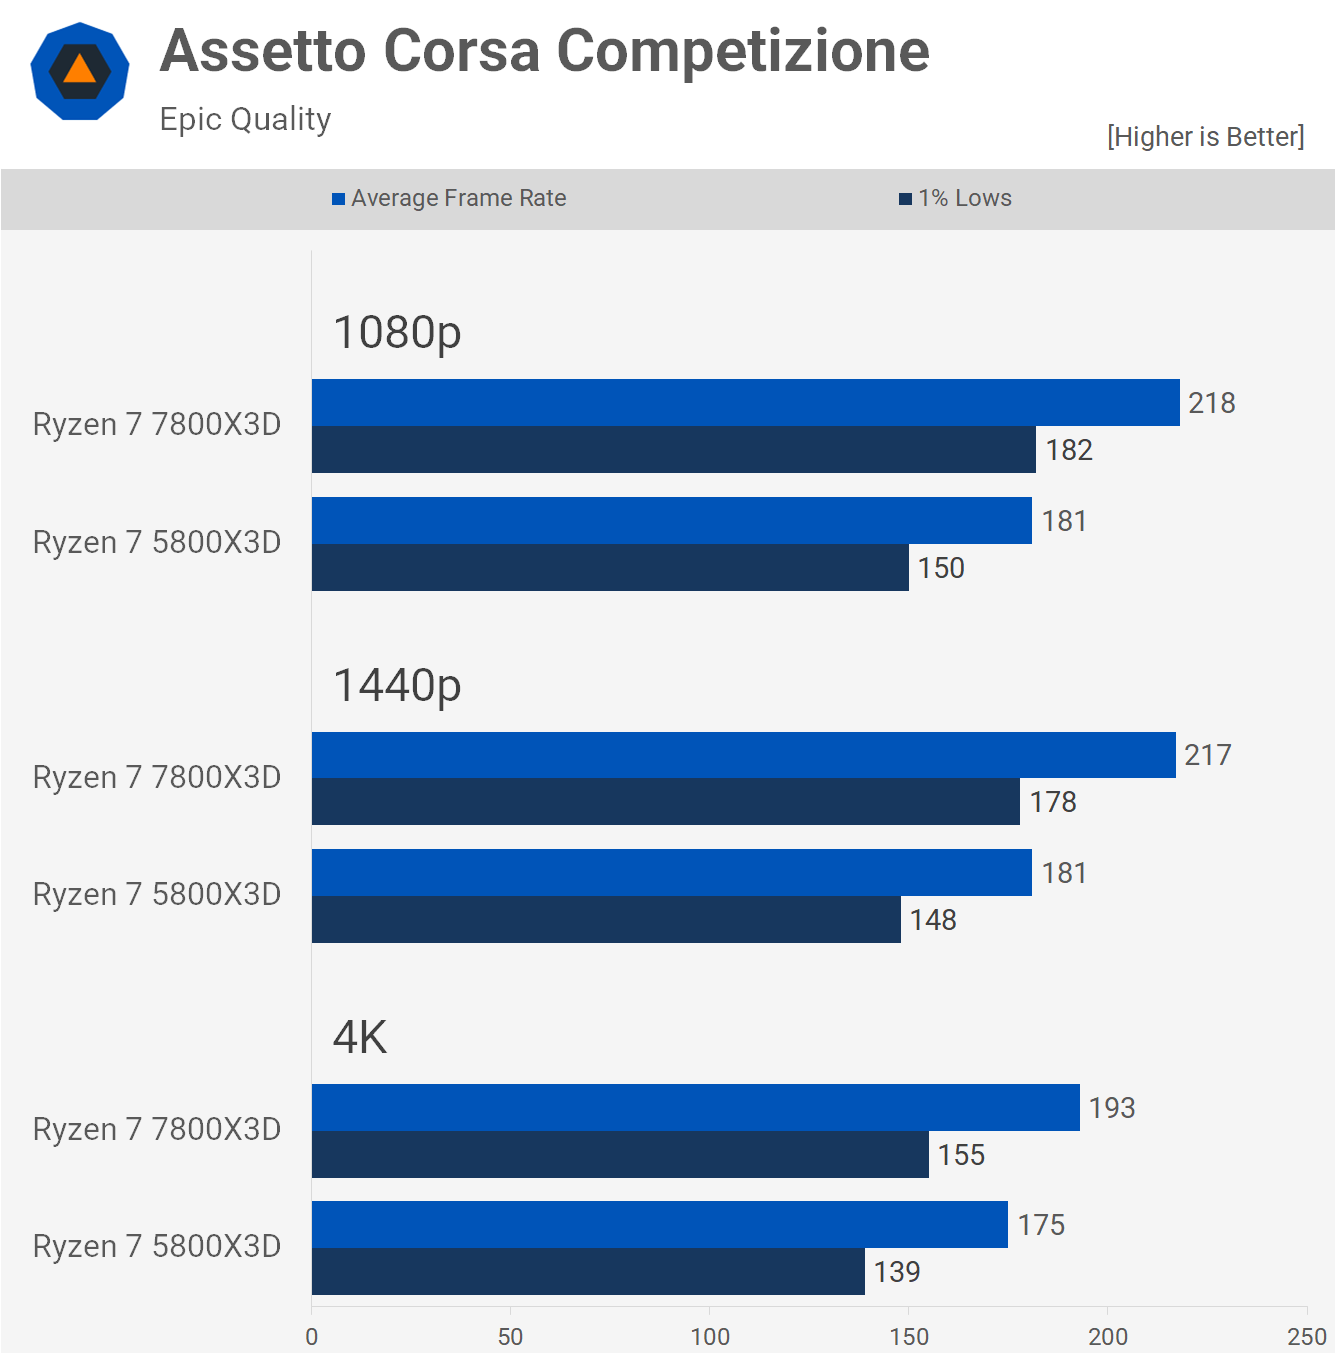
The 5800X3D has previously proven to be a powerhouse in ACC, and although performance is heavily CPU-limited, even with the Epic quality settings, we're still looking at 181 fps at 1080p and 1440p. This meant that the 7800X3D was around 20% faster, and even 10% faster at 4K.
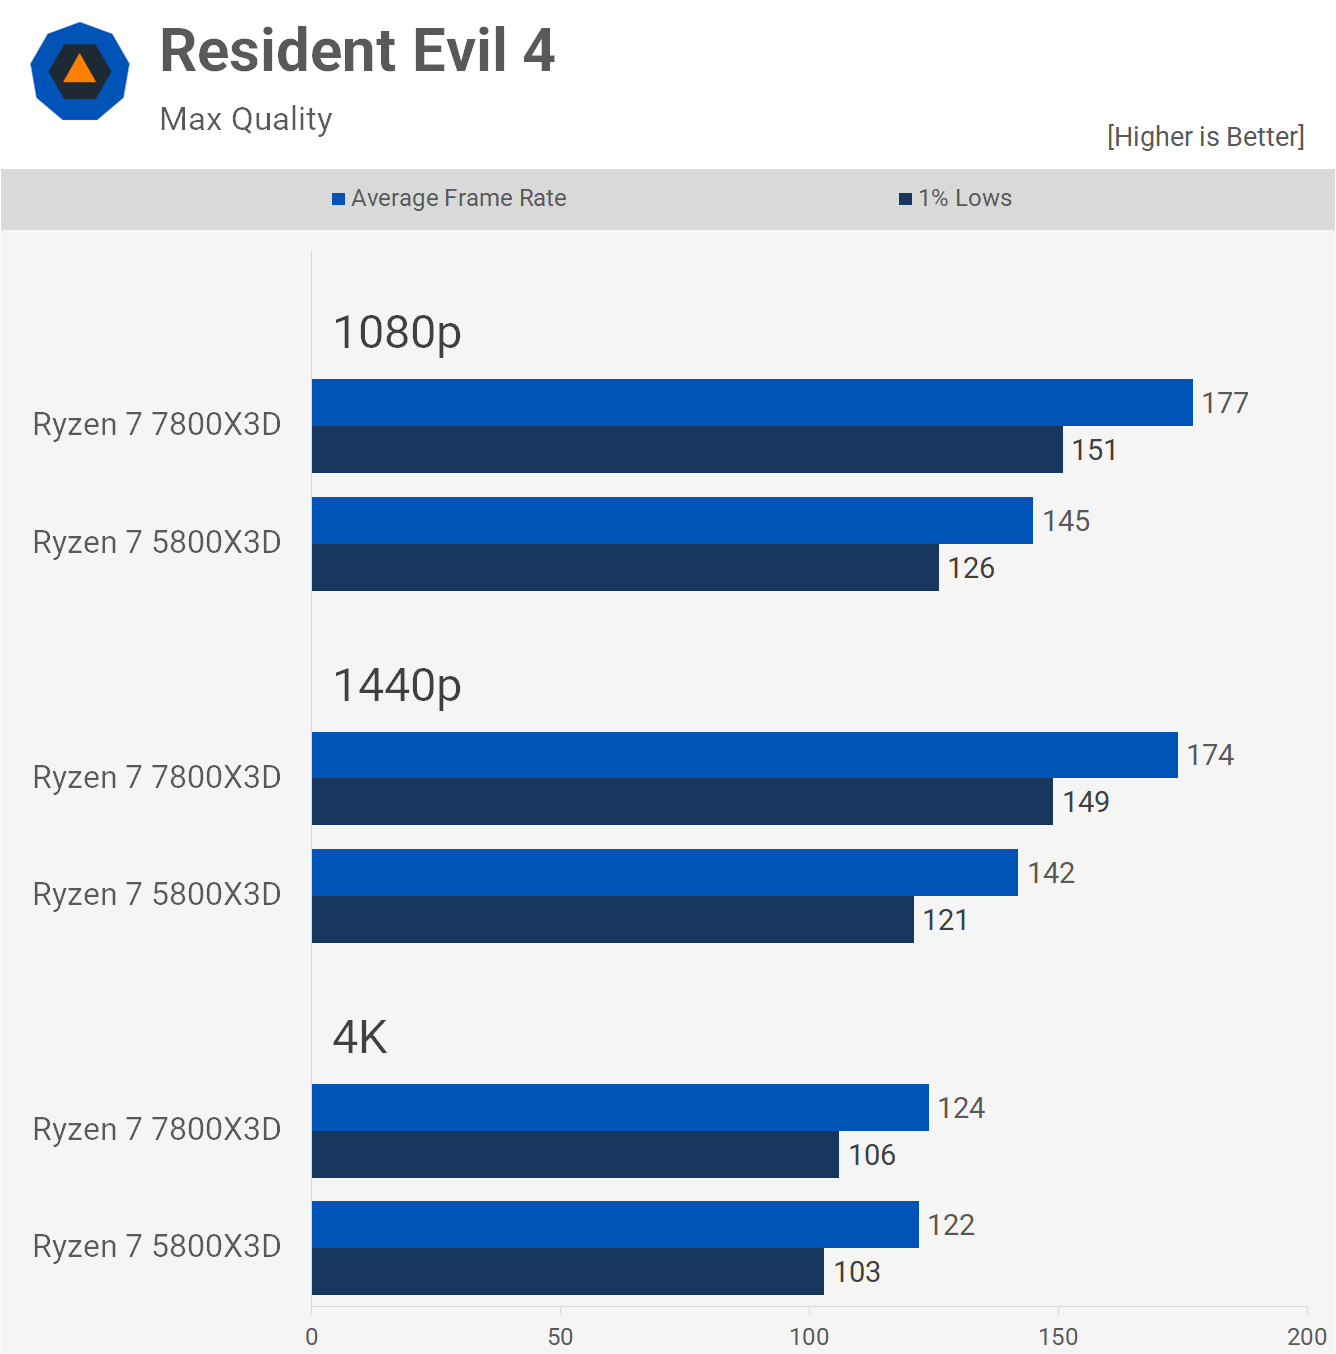
We found the 5800X3D more than capable in Resident Evil 4 with over 140 fps at 1080p and 1440p before becoming GPU-limited at 4K. The 7800X3D was around 22% faster at 1080p and 1440p with just over 170 fps, a significant performance uplift. However, in this example, the extra frames aren't exactly necessary.
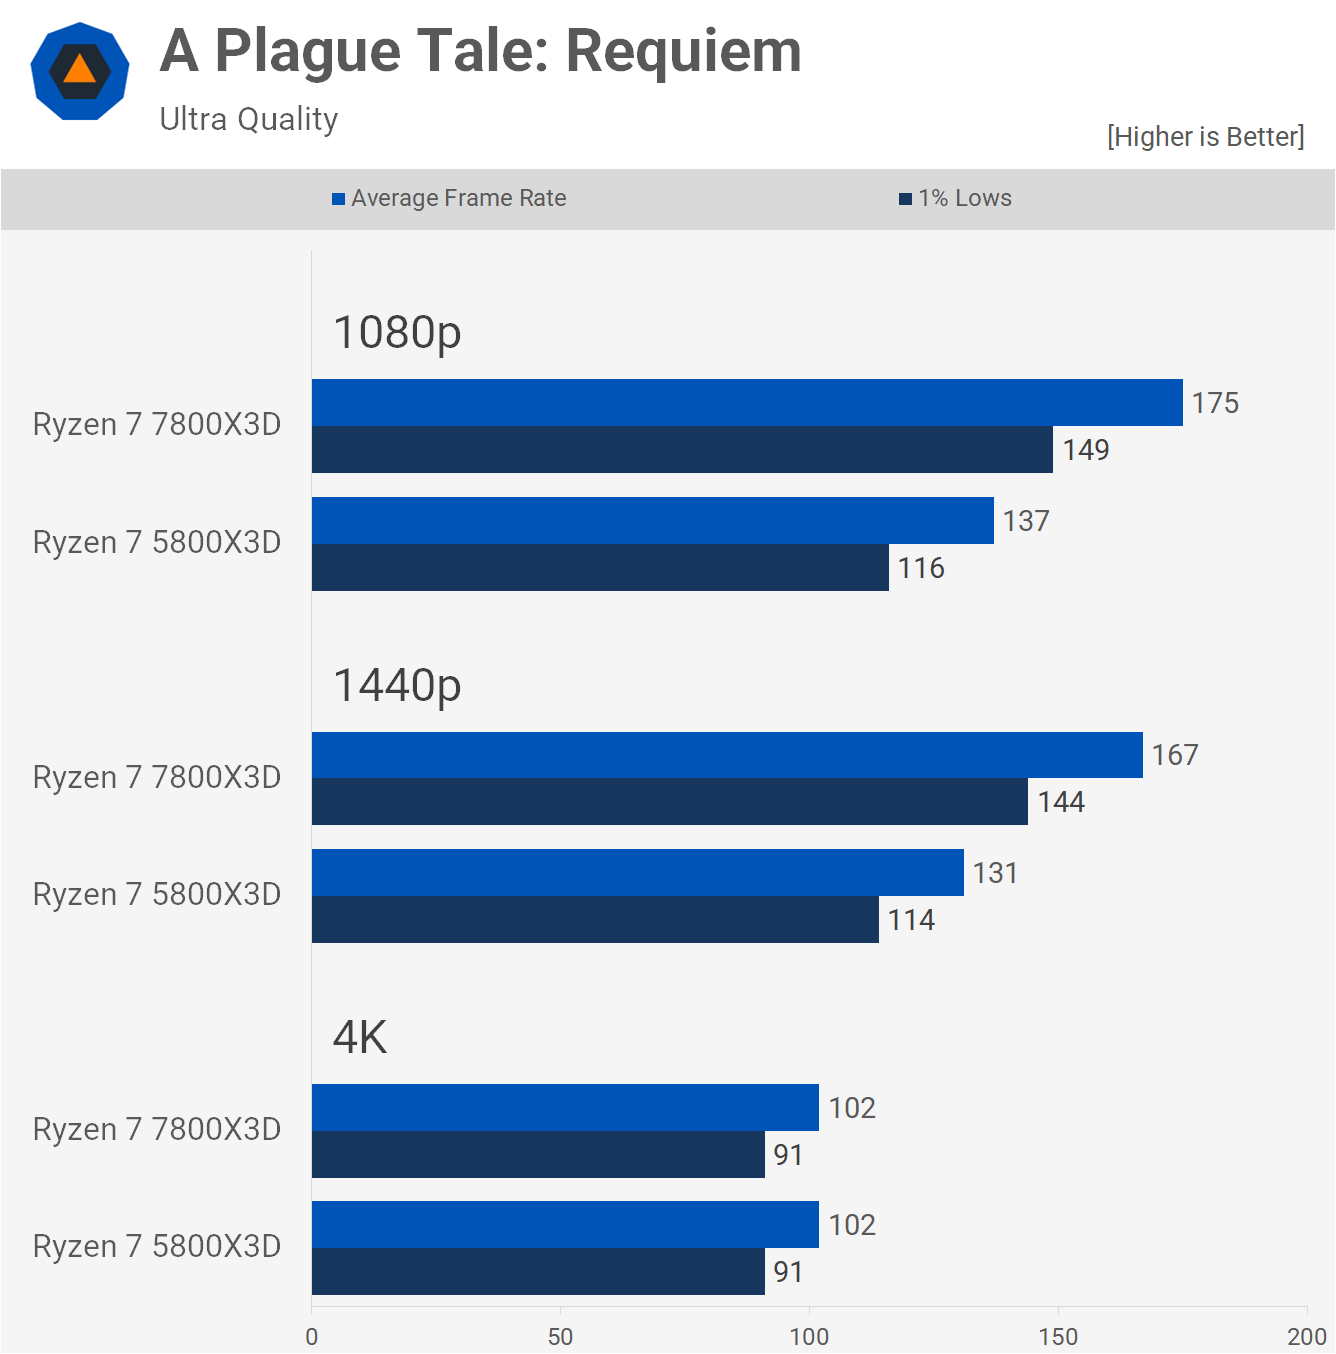
A Plague Tale: Requiem can be comfortably played at 70-80 fps in our opinion, though a high refresh rate experience is desirable, and the 5800X3D will enable that. Even so, the 7800X3D is up to 28% faster at 1080p and 1440p, before performance becomes entirely GPU-limited at 4K.
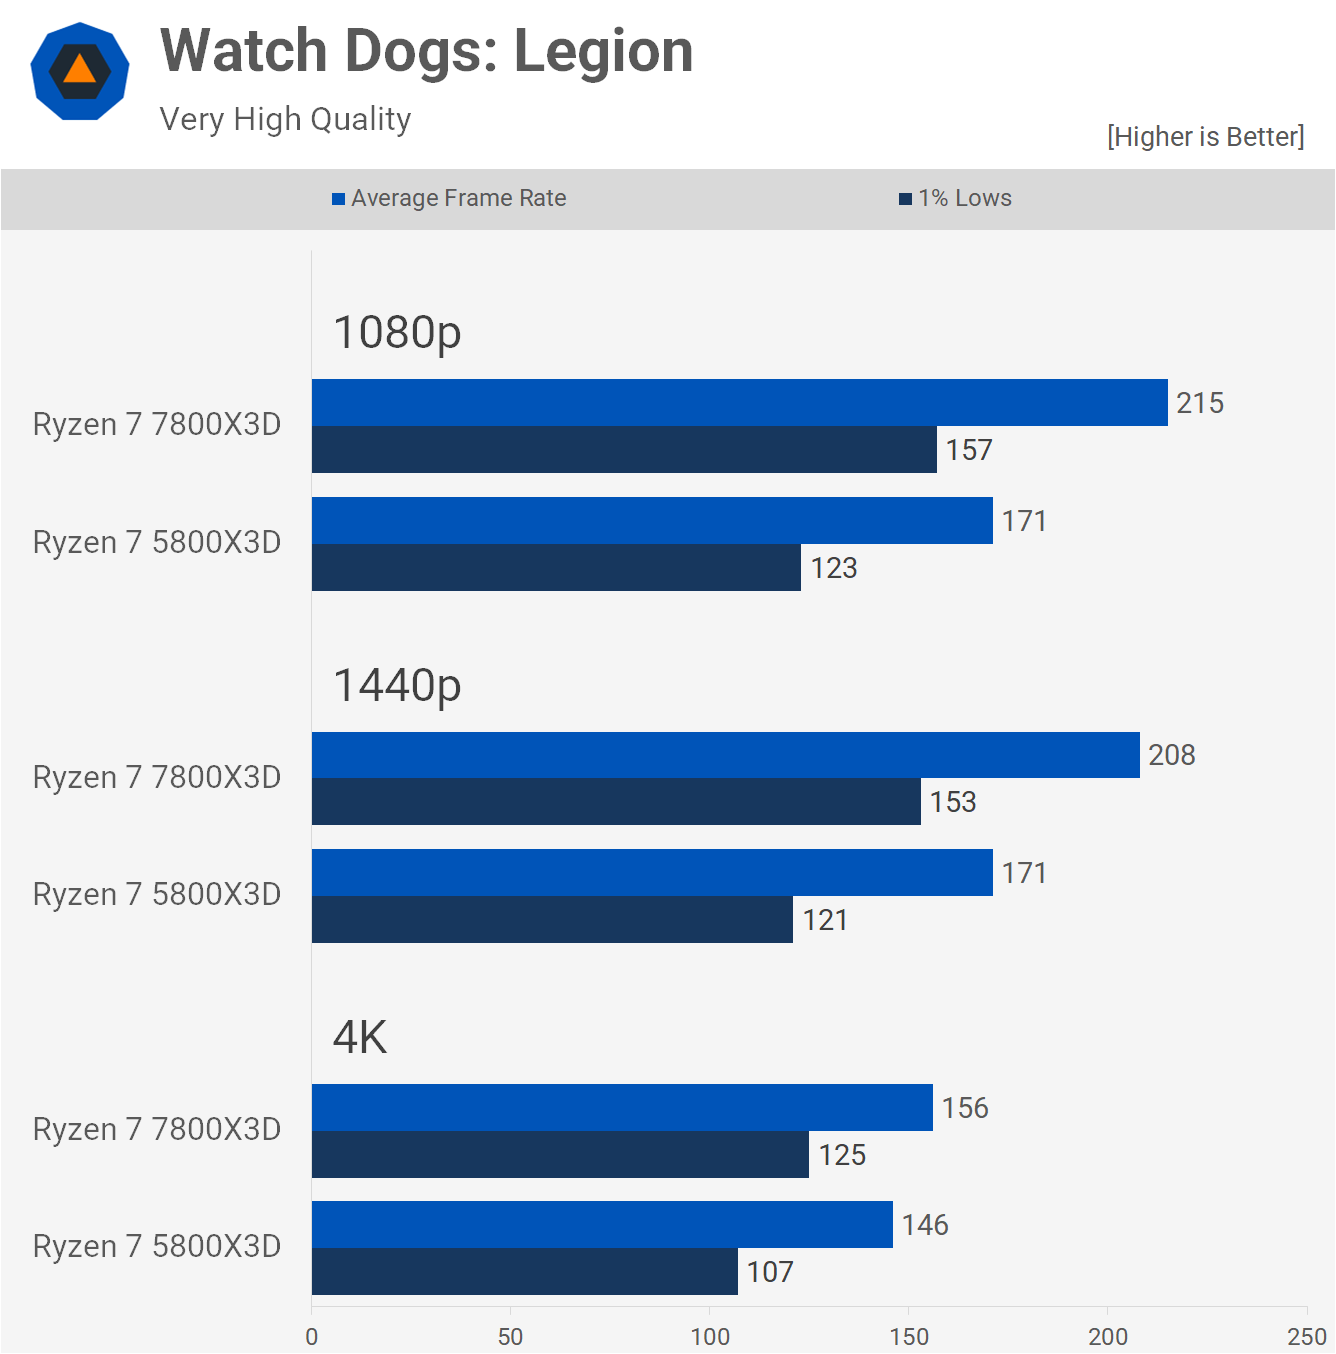
Watch Dogs: Legion is a CPU-intensive game, but the 5800X3D is still more than capable here with 171 fps on average at 1080p and 1440p, suggesting that performance was heavily CPU-limited. But that's also the case with the 7800X3D, which was up to 26% faster, but still limited the RTX 4090 to just over 200 fps.
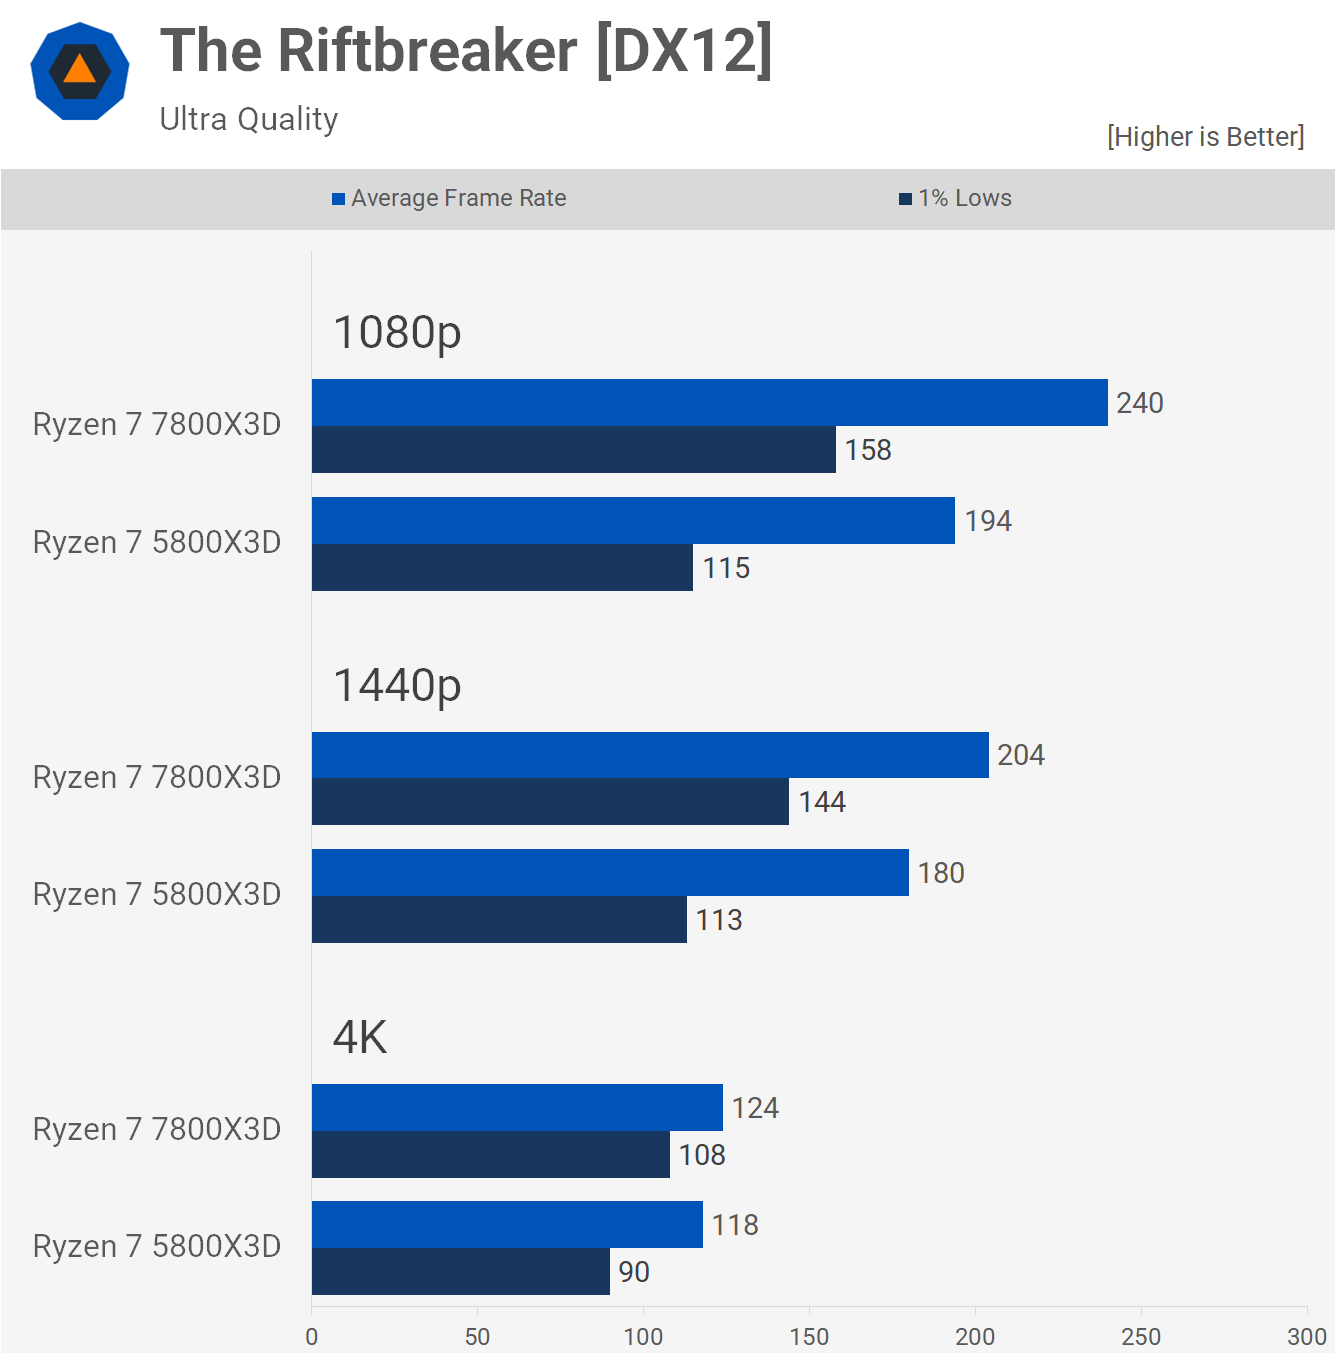
The Riftbreaker is an excellent CPU benchmark and, although the 5800X3D performs admirably, delivering almost 200 fps at 1080p, the 7800X3D was 24% faster, with 1% lows boosted by 37%. However, if playing at 4K, the difference is much smaller, as one might expect.
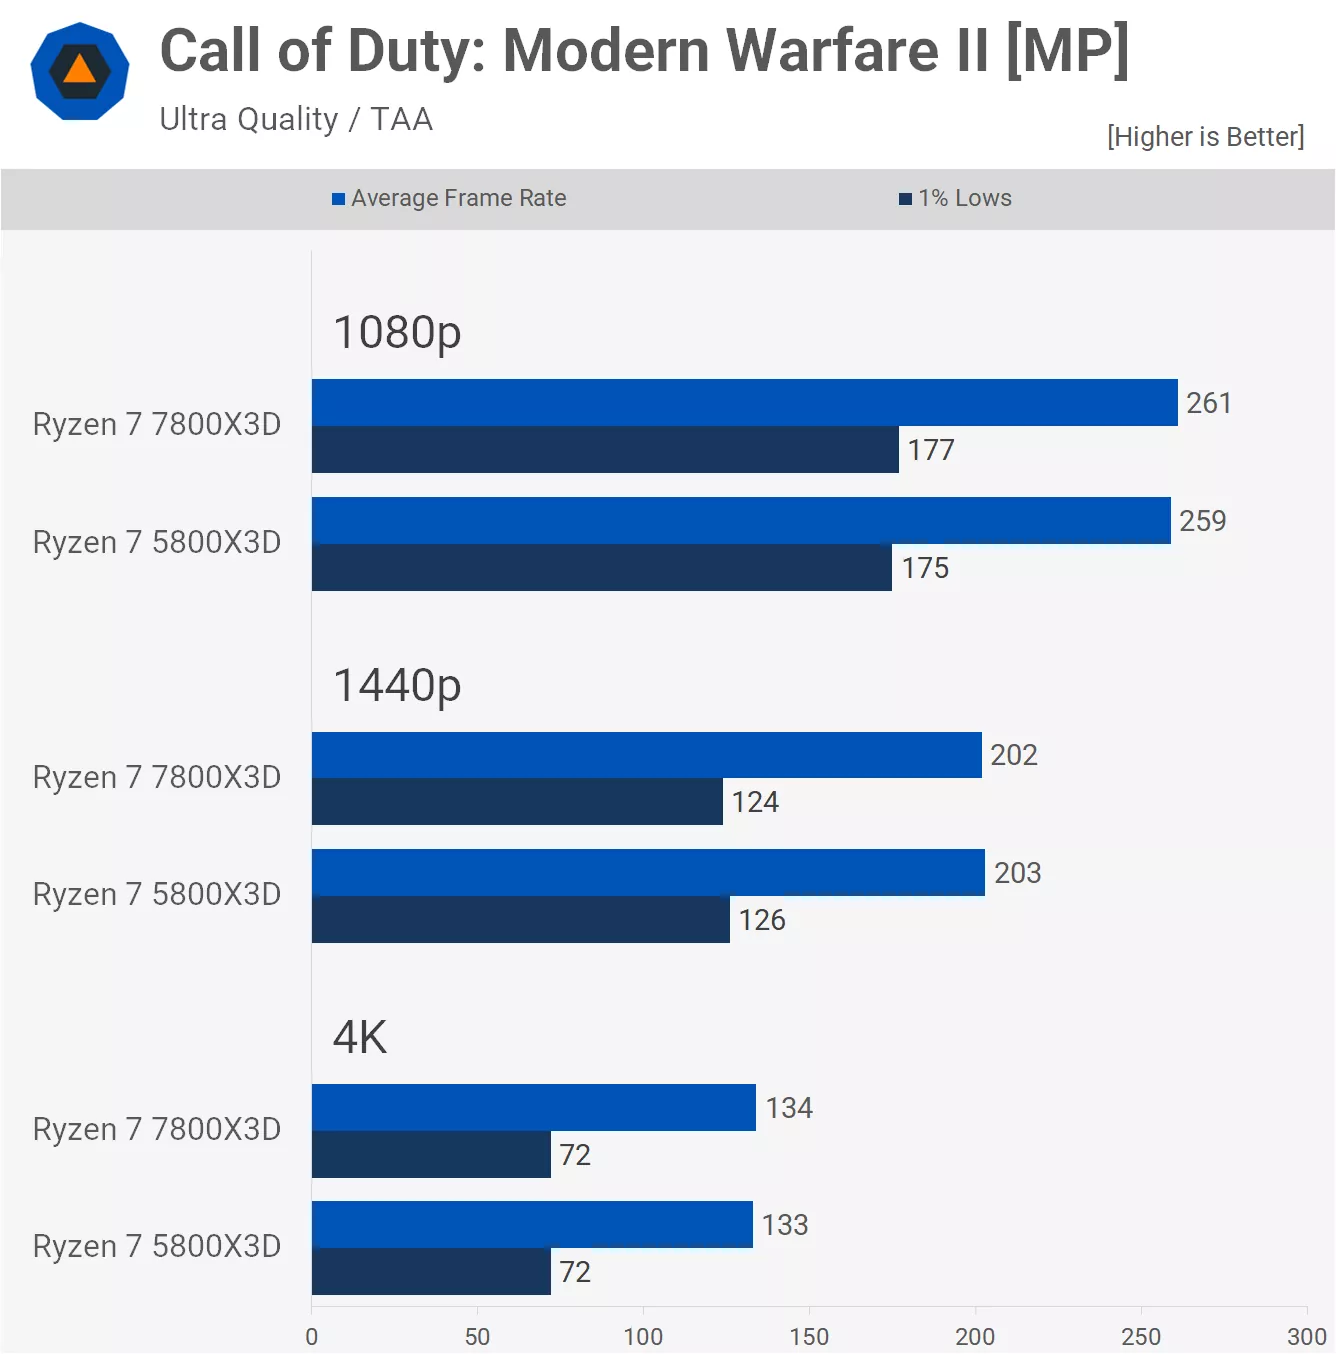
The Call of Duty: Modern Warfare II benchmark saw the 5800X3D and 7800X3D produce the same results, around 260 fps at 1080p, 200 fps at 1440p, and 130 fps at 4K. So, overall, good results.
Performance Summary
Having scrutinized the performance of both the Ryzen 7 5800X3D and 7800X3D across a diverse range of games, now it's time to break down all the data to get a clear picture of just how much faster the new Zen 4 3D V-Cache part is…
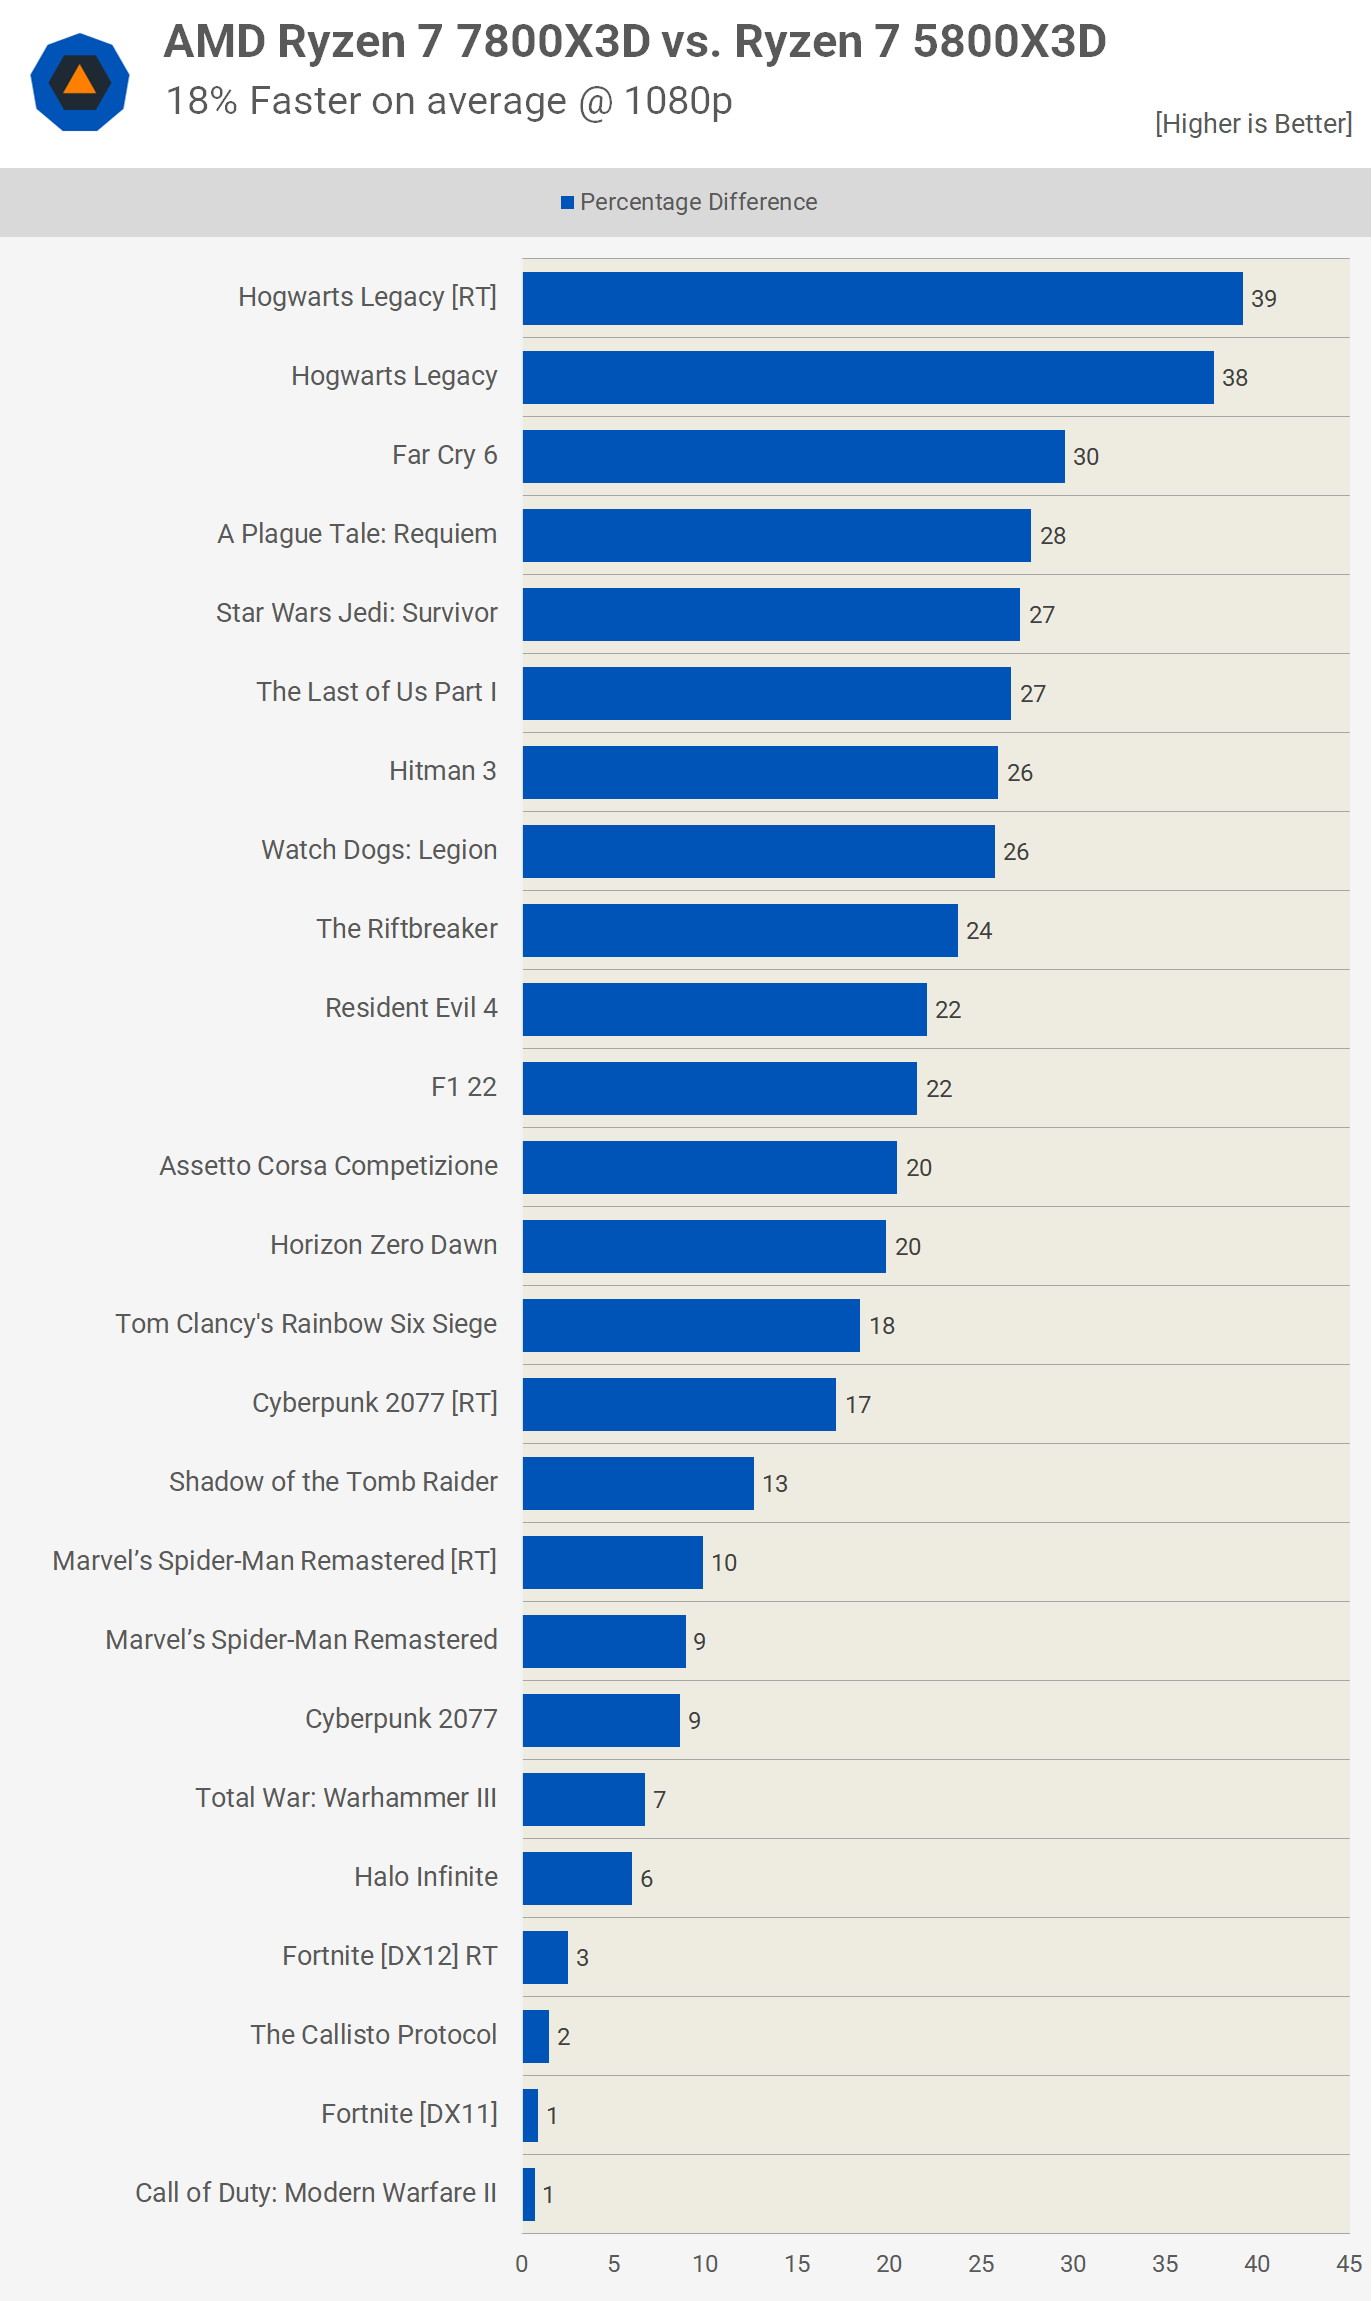
On average, the 7800X3D surpassed the 5800X3D by 18%. This isn't a massive margin, but it's a noteworthy difference for the CPU to make. Instances of over 30% were observed in Far Cry 6 and Hogwarts Legacy, illustrating the new Zen 4 CPU's potential to outperform significantly depending on the game.
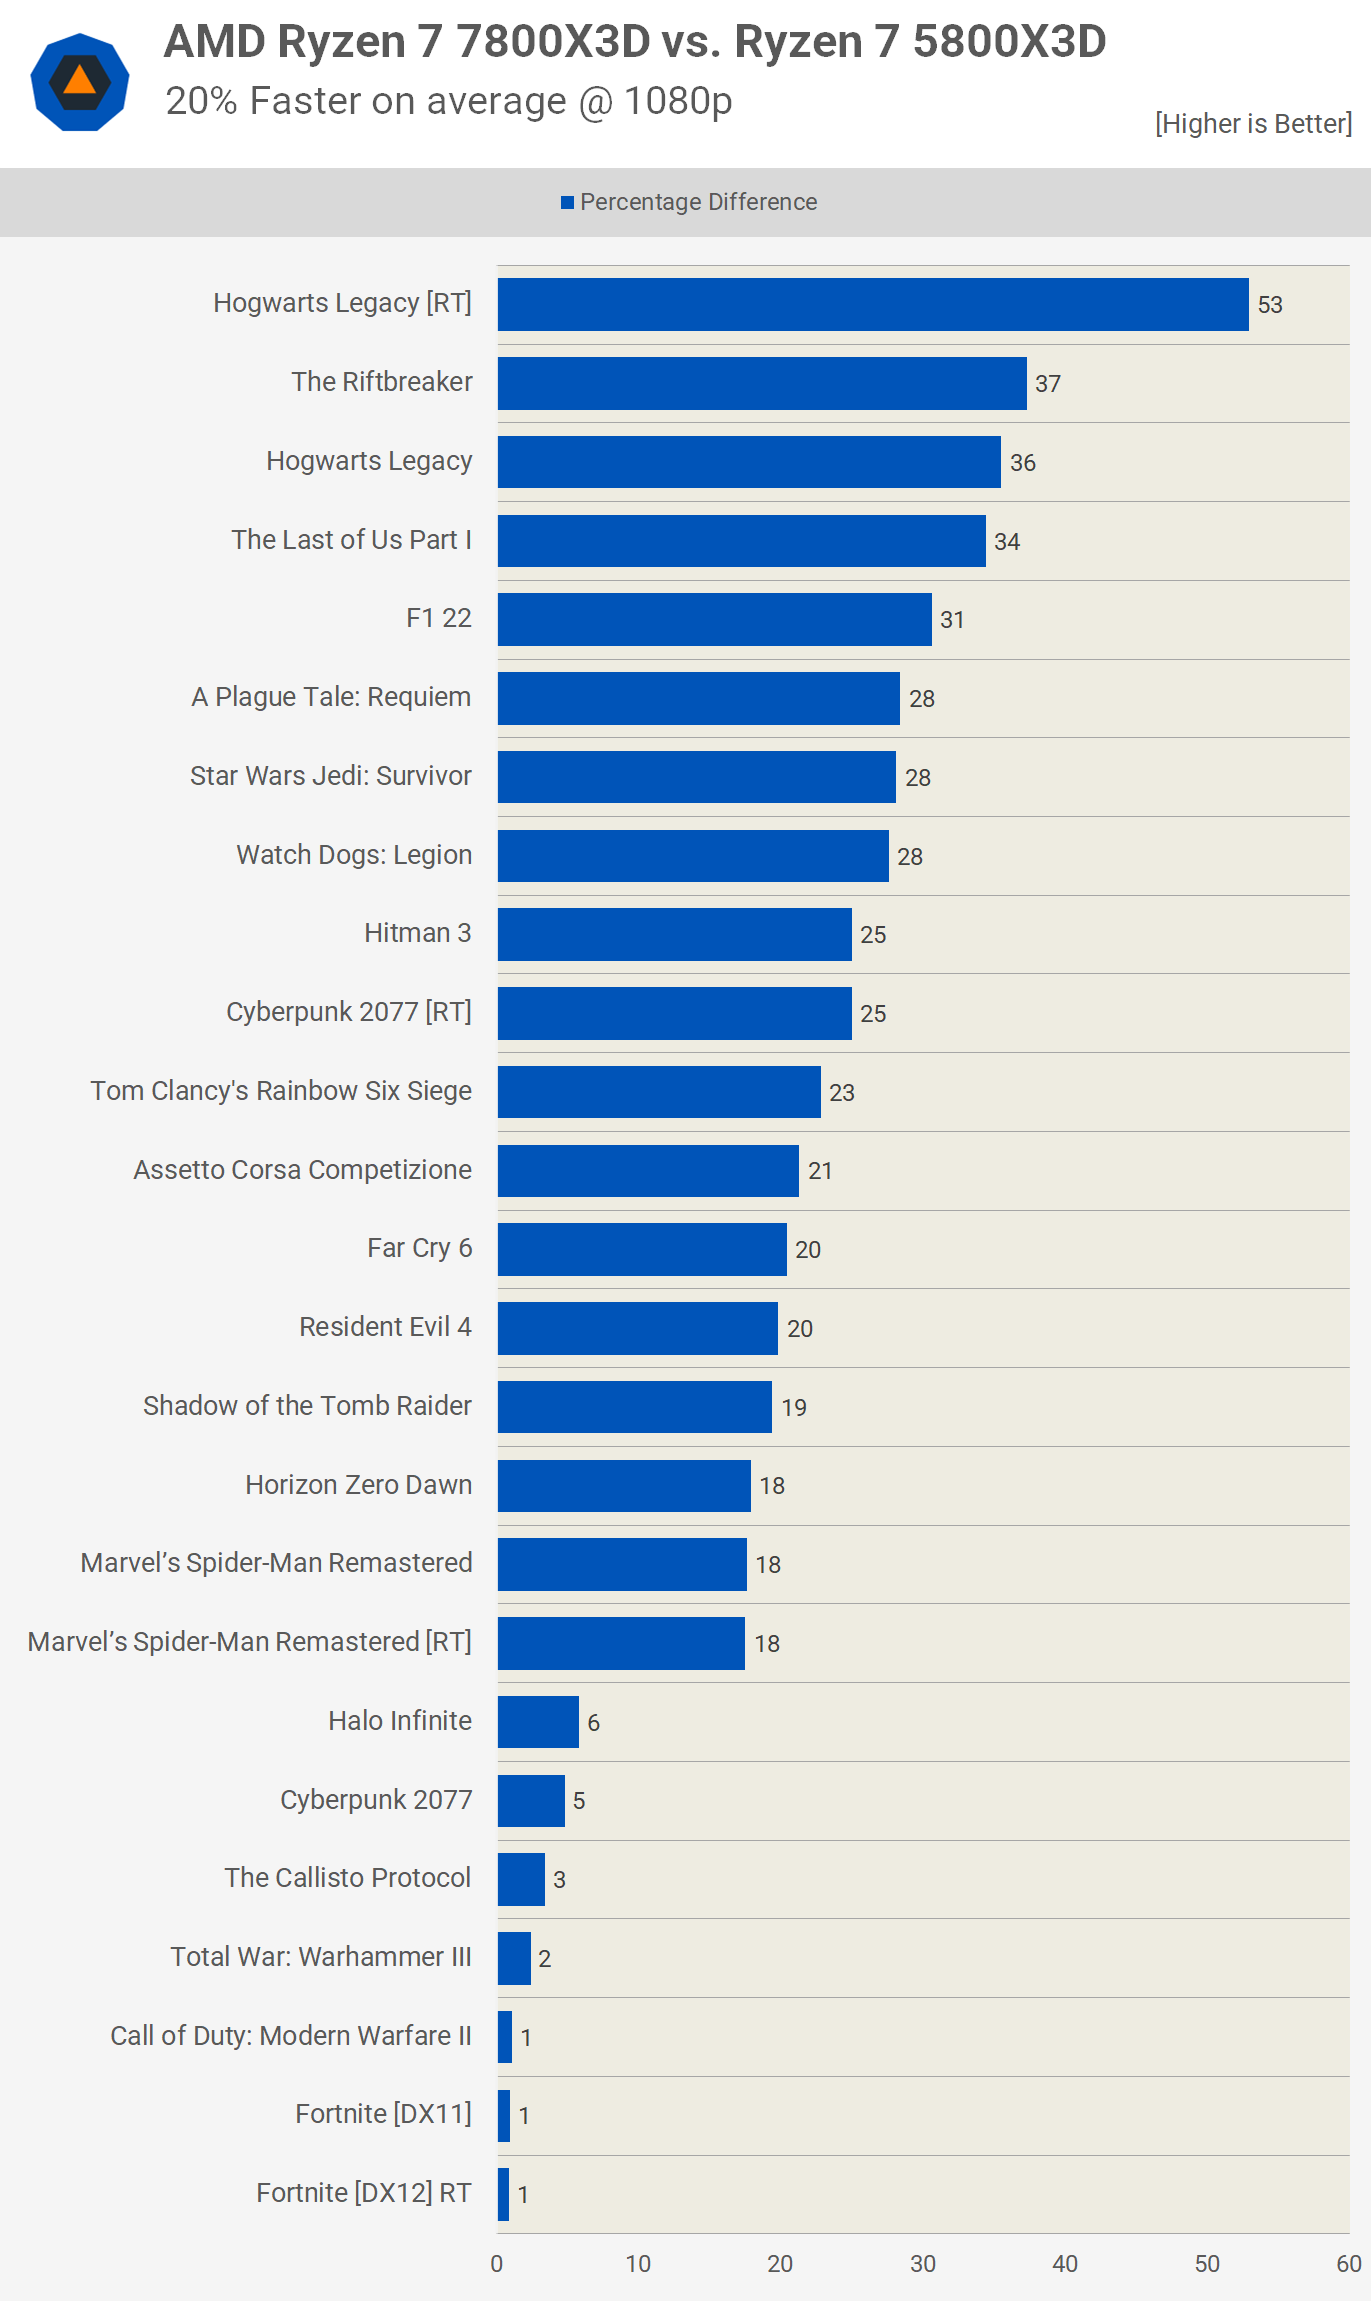
For those curious about the 1% lows, the overall margin is strikingly similar with the 7800X3D outperforming by 20% on average. Margins as vast as 53% were observed, most notably in Hogwarts Legacy with ray tracing enabled. We hypothesize that this margin can largely be attributed to memory bandwidth, with the DDR5 support of the Zen 4 processor offering a substantial advantage here. We're also witnessing gains of 30% or more in F1 22, The Last of Us, and The Riftbreaker.
As you'd expect, upping the resolution to 1440p diminishes the margins as the results become more GPU-limited. Here, the 7800X3D led by just 12% on average, although margins as great as 41% still occurred. However, there were more than half a dozen examples where the margin was 2% or less, resulting in equivalent gaming experiences.
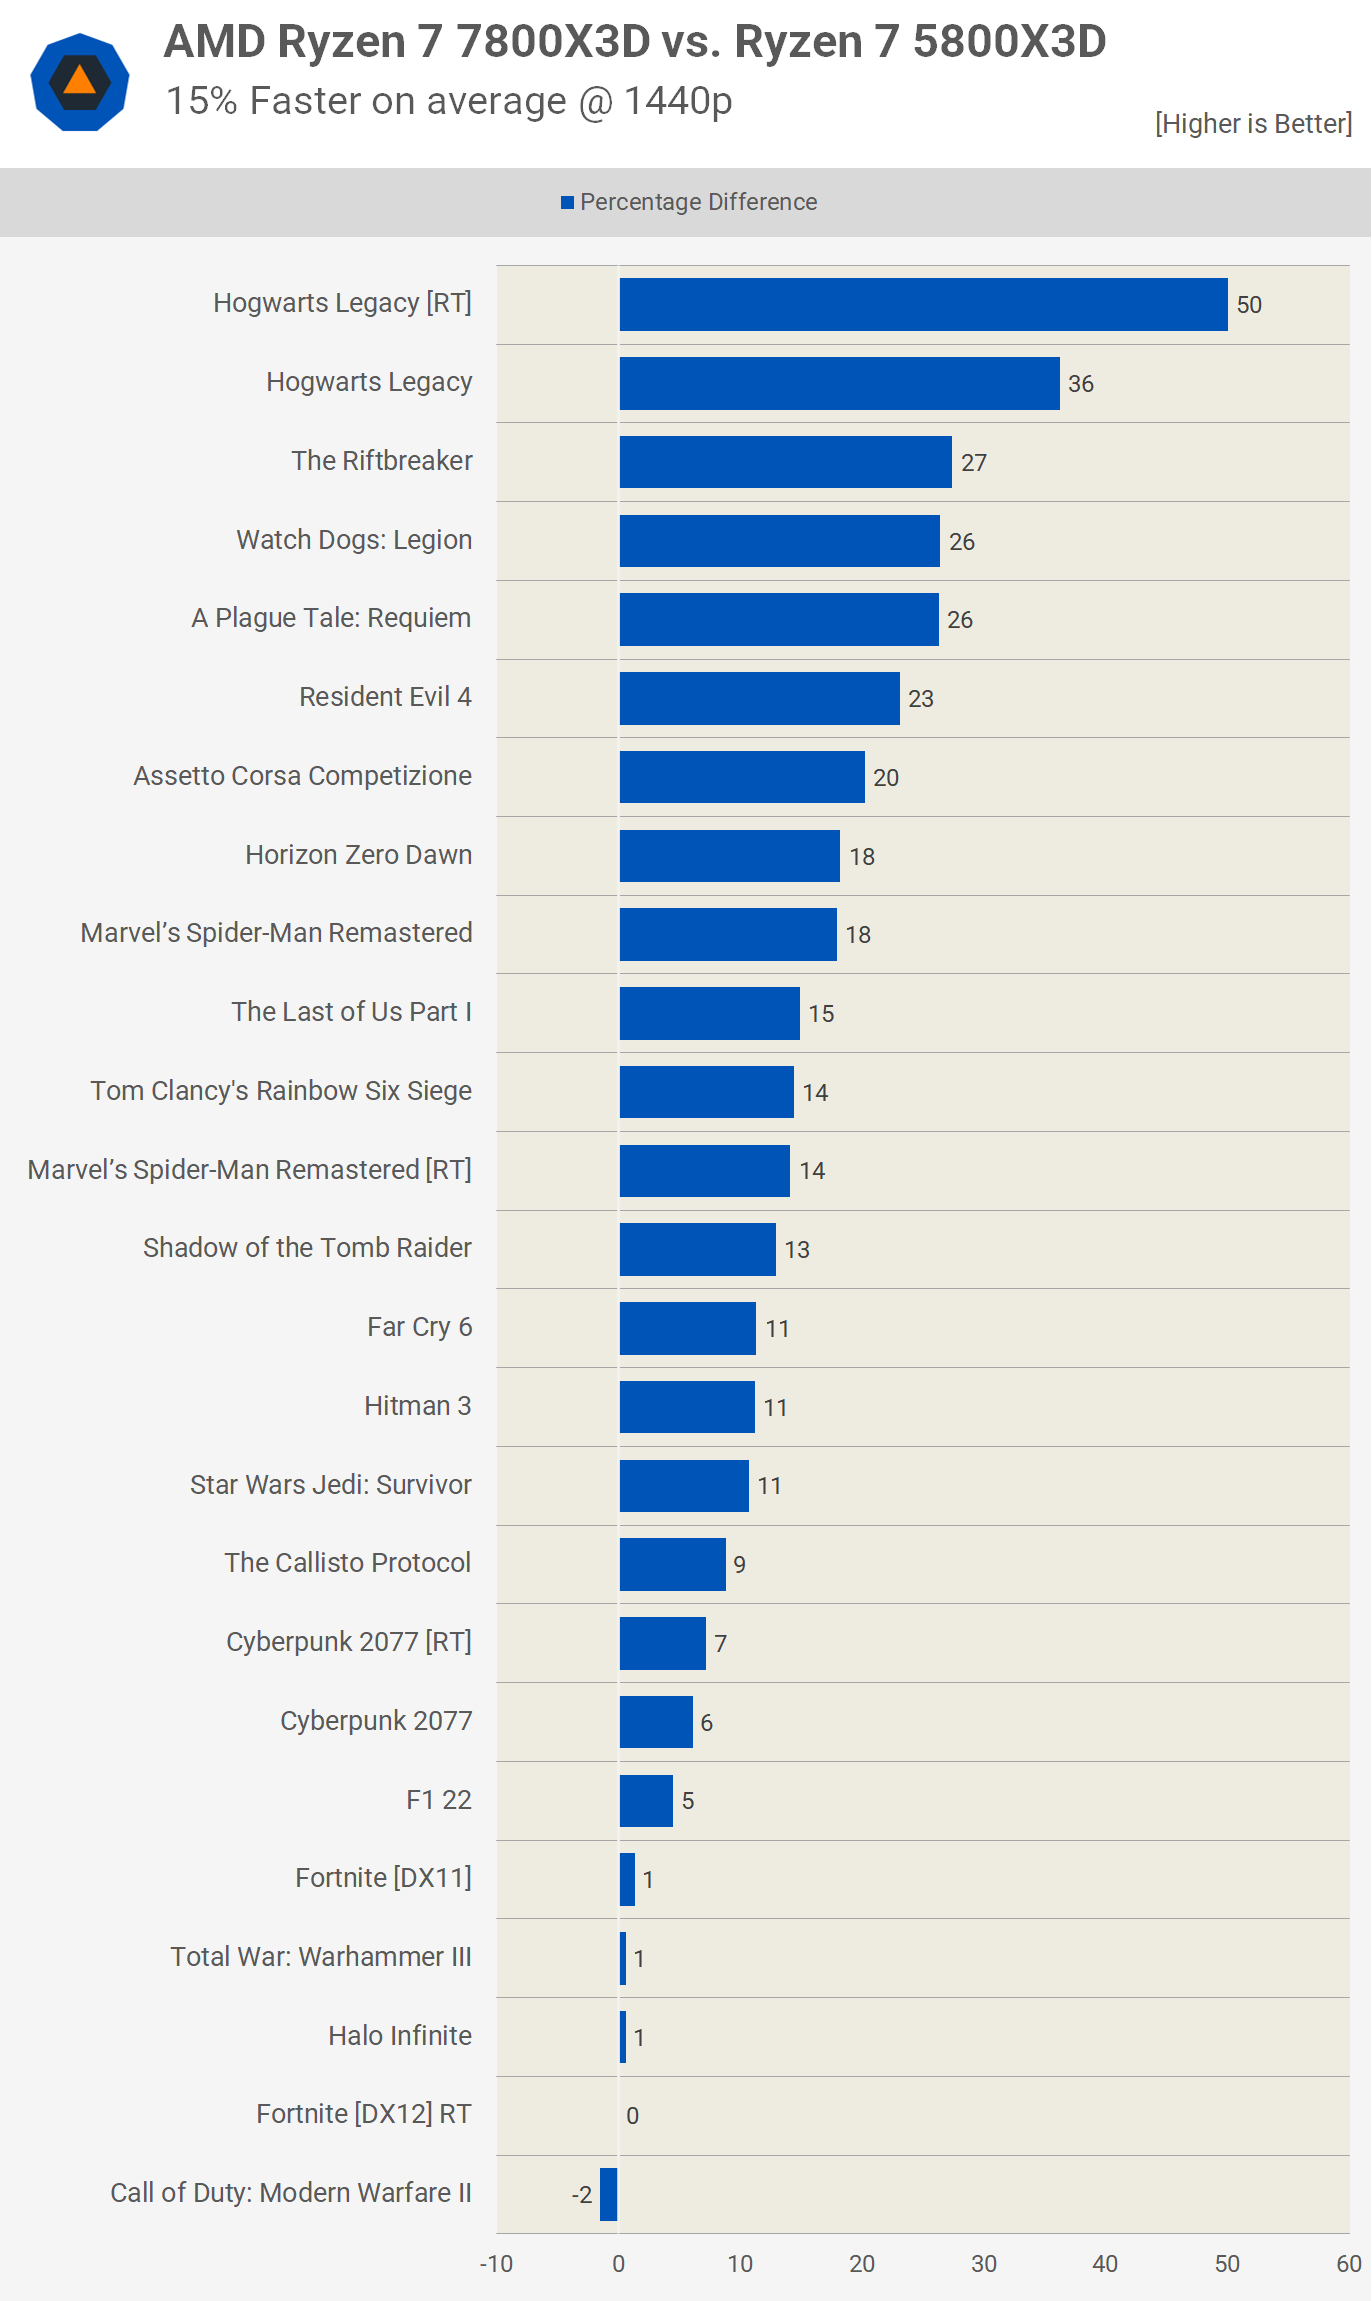
It's a similar story for the 1% lows, here the 7800X3D was 15% faster on average with 7 examples where the margin was 20% or greater. Again Hogwarts Legacy with ray tracing enabled is somewhat of an outlier here, favouring the 7800X3D by a 50% margin.
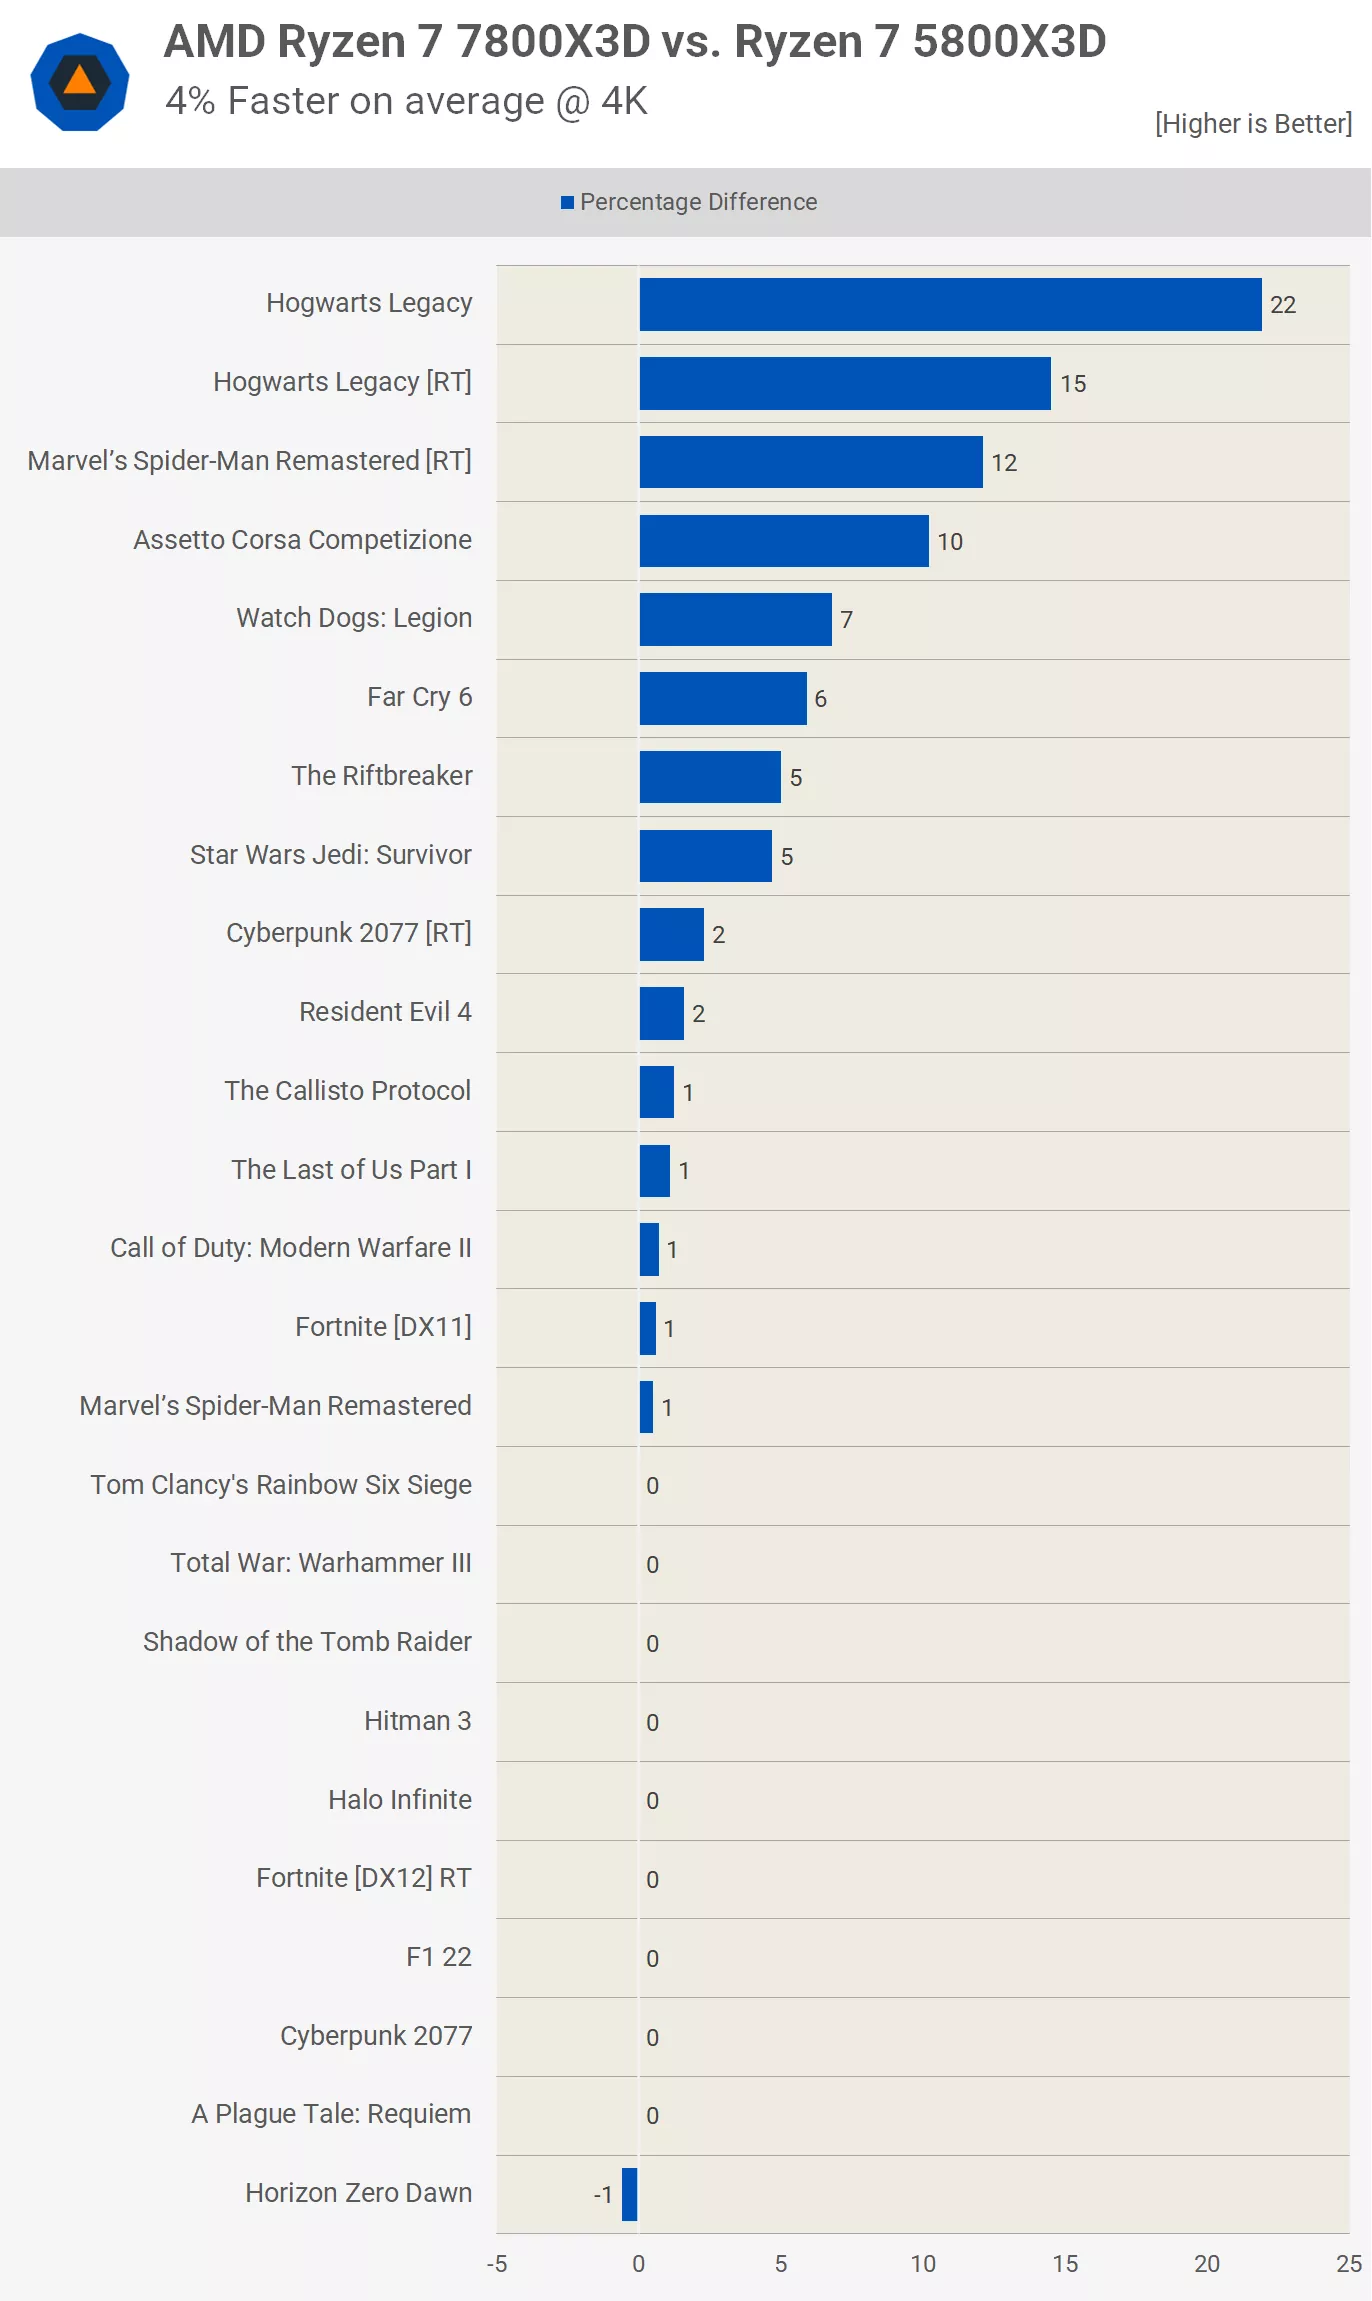
Finally, at the much more GPU-limited 4K resolution, the 5800X3D and 7800X3D performed similarly, with the Zen 4 part delivering just 4% greater performance on average. There were only four instances of double-digit margins, observed in Hogwarts Legacy (with and without ray tracing), Spider-Man (with ray tracing), and ACC.
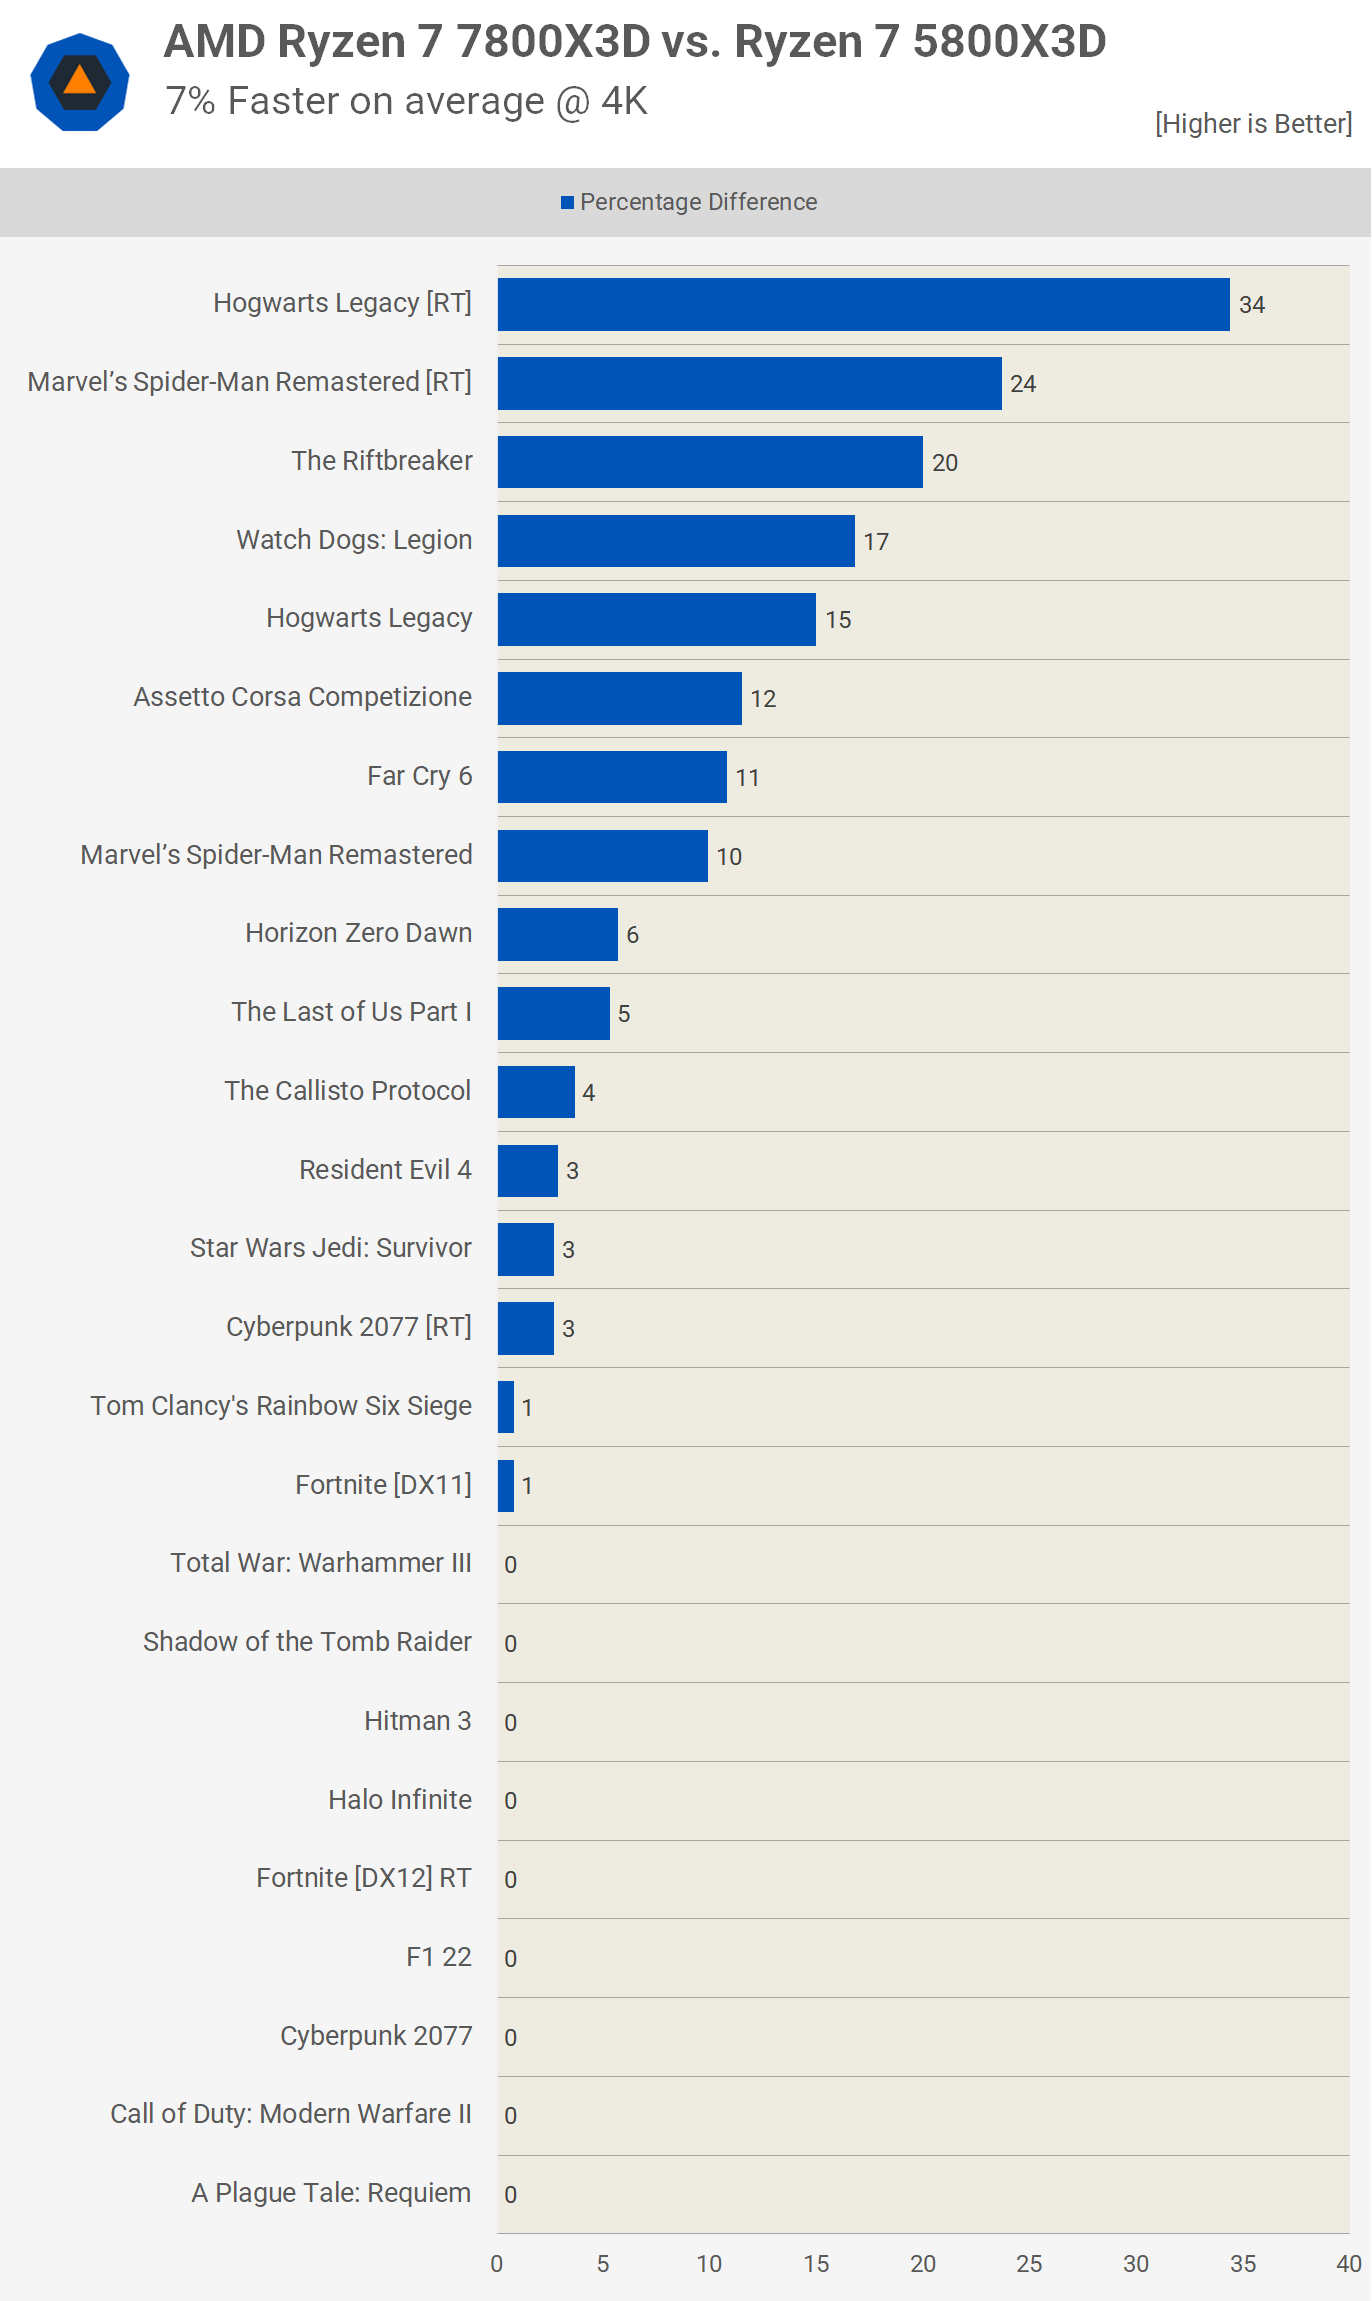
Concerning the 1% lows, they illustrate a similar picture, with the 7800X3D being just 7% faster on average. Yet again, we observed much larger margins in a few games like Hogwarts Legacy, Spider-Man, and The Riftbreaker.
What We Learned
As you probably expected, the Ryzen 7800X3D outperforms the 5800X3D, but the degree of its superiority might surprise some. When CPU-limited, the performance uplift is substantial, with instances of significant gains. However, depending on the games you play and your style of play, the improvement could be negligible.
While we've included 4K benchmarks due to popular demand, we advise against focusing on them exclusively, as doing so could potentially mislead. If you're planning to keep your newly purchased CPU for the foreseeable future, understanding how it compares to other market options when CPU-limited could prevent future disappointment. If more games start to resemble Hogwarts Legacy and fewer like Fortnite, the 7800X3D is likely to significantly outpace the 5800X3D in a few years.
The 4K data might be helpful for assessing whether an upgrade will offer any immediate performance boost. Still, realistically, you can determine this independently using some basic diagnostic tools. Let's now discuss which option would be most beneficial for you.
At present, the 5800X3D is substantially more affordable at $320, with a few retailers like B&H and Amazon selling them for just $290 – a deal that we anticipate won't last. By contrast, the 7800X3D is priced significantly higher at $450 (its MSRP). Essentially, you'd be paying at least 40% more for the 7800X3D when comparing only the cost of the processors, and while it offered up to 40-50% more speed depending on the game and quality settings, you're typically looking at a performance boost of 15-20%.
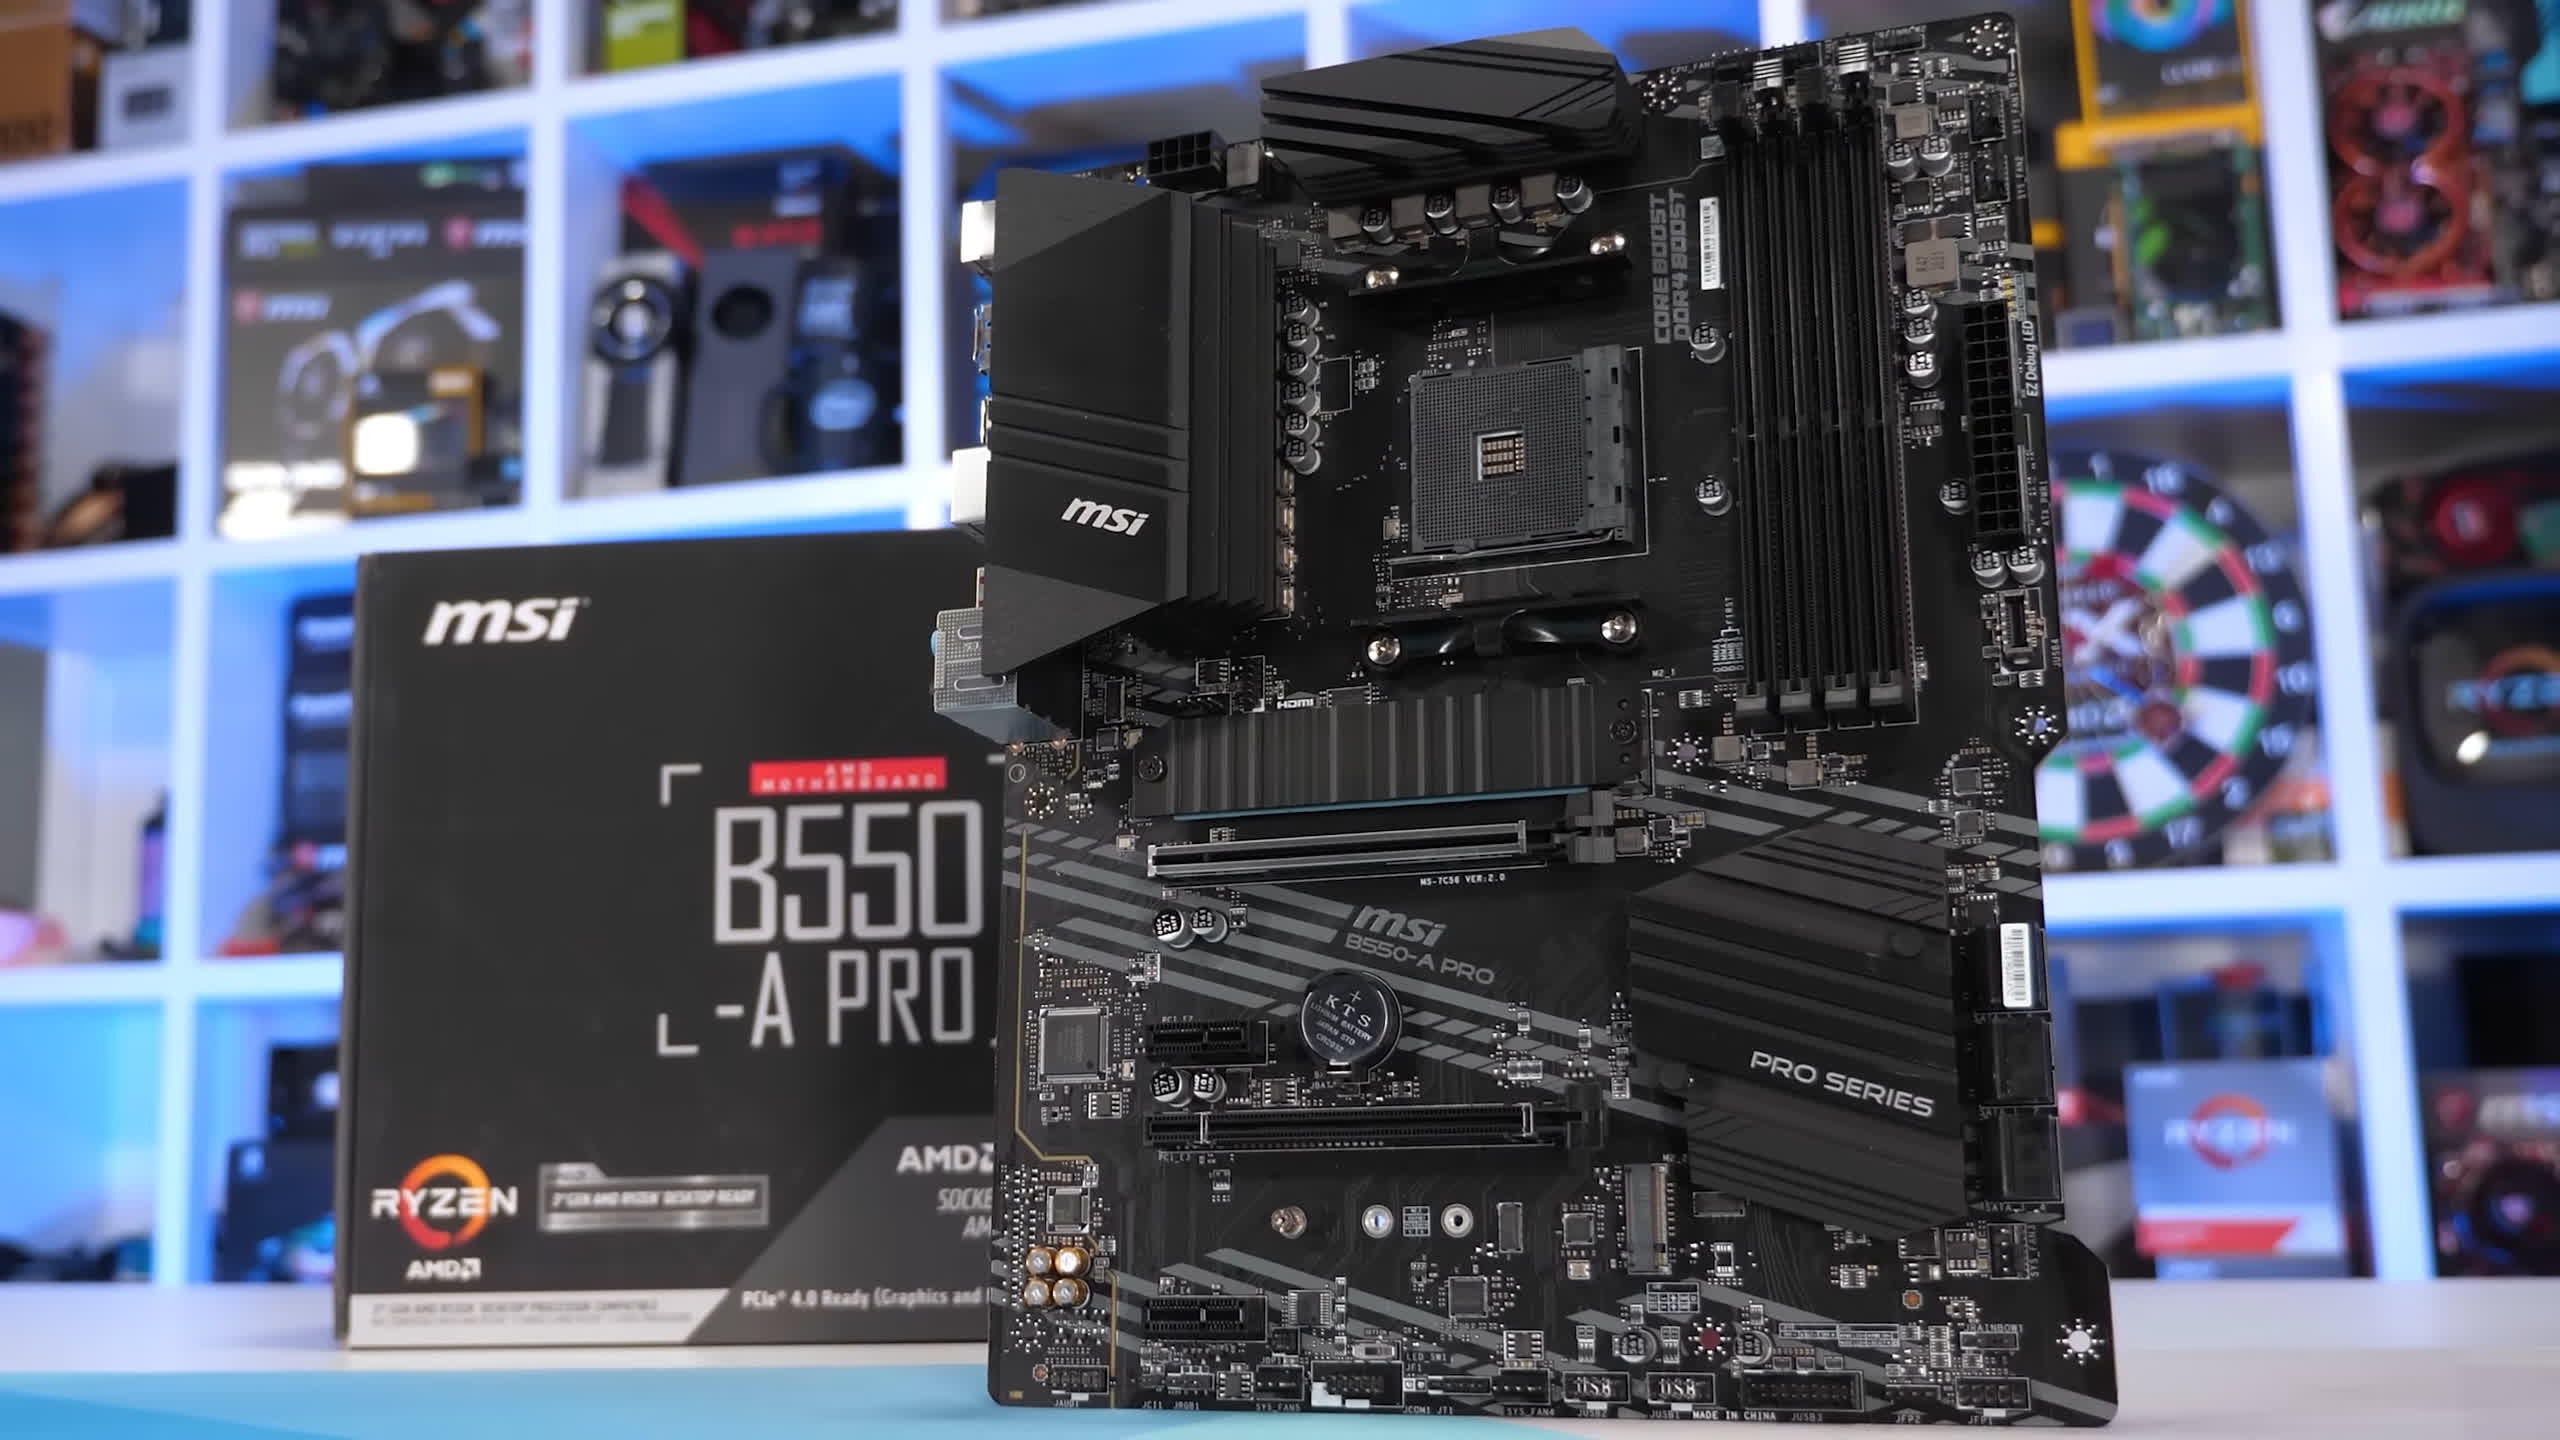
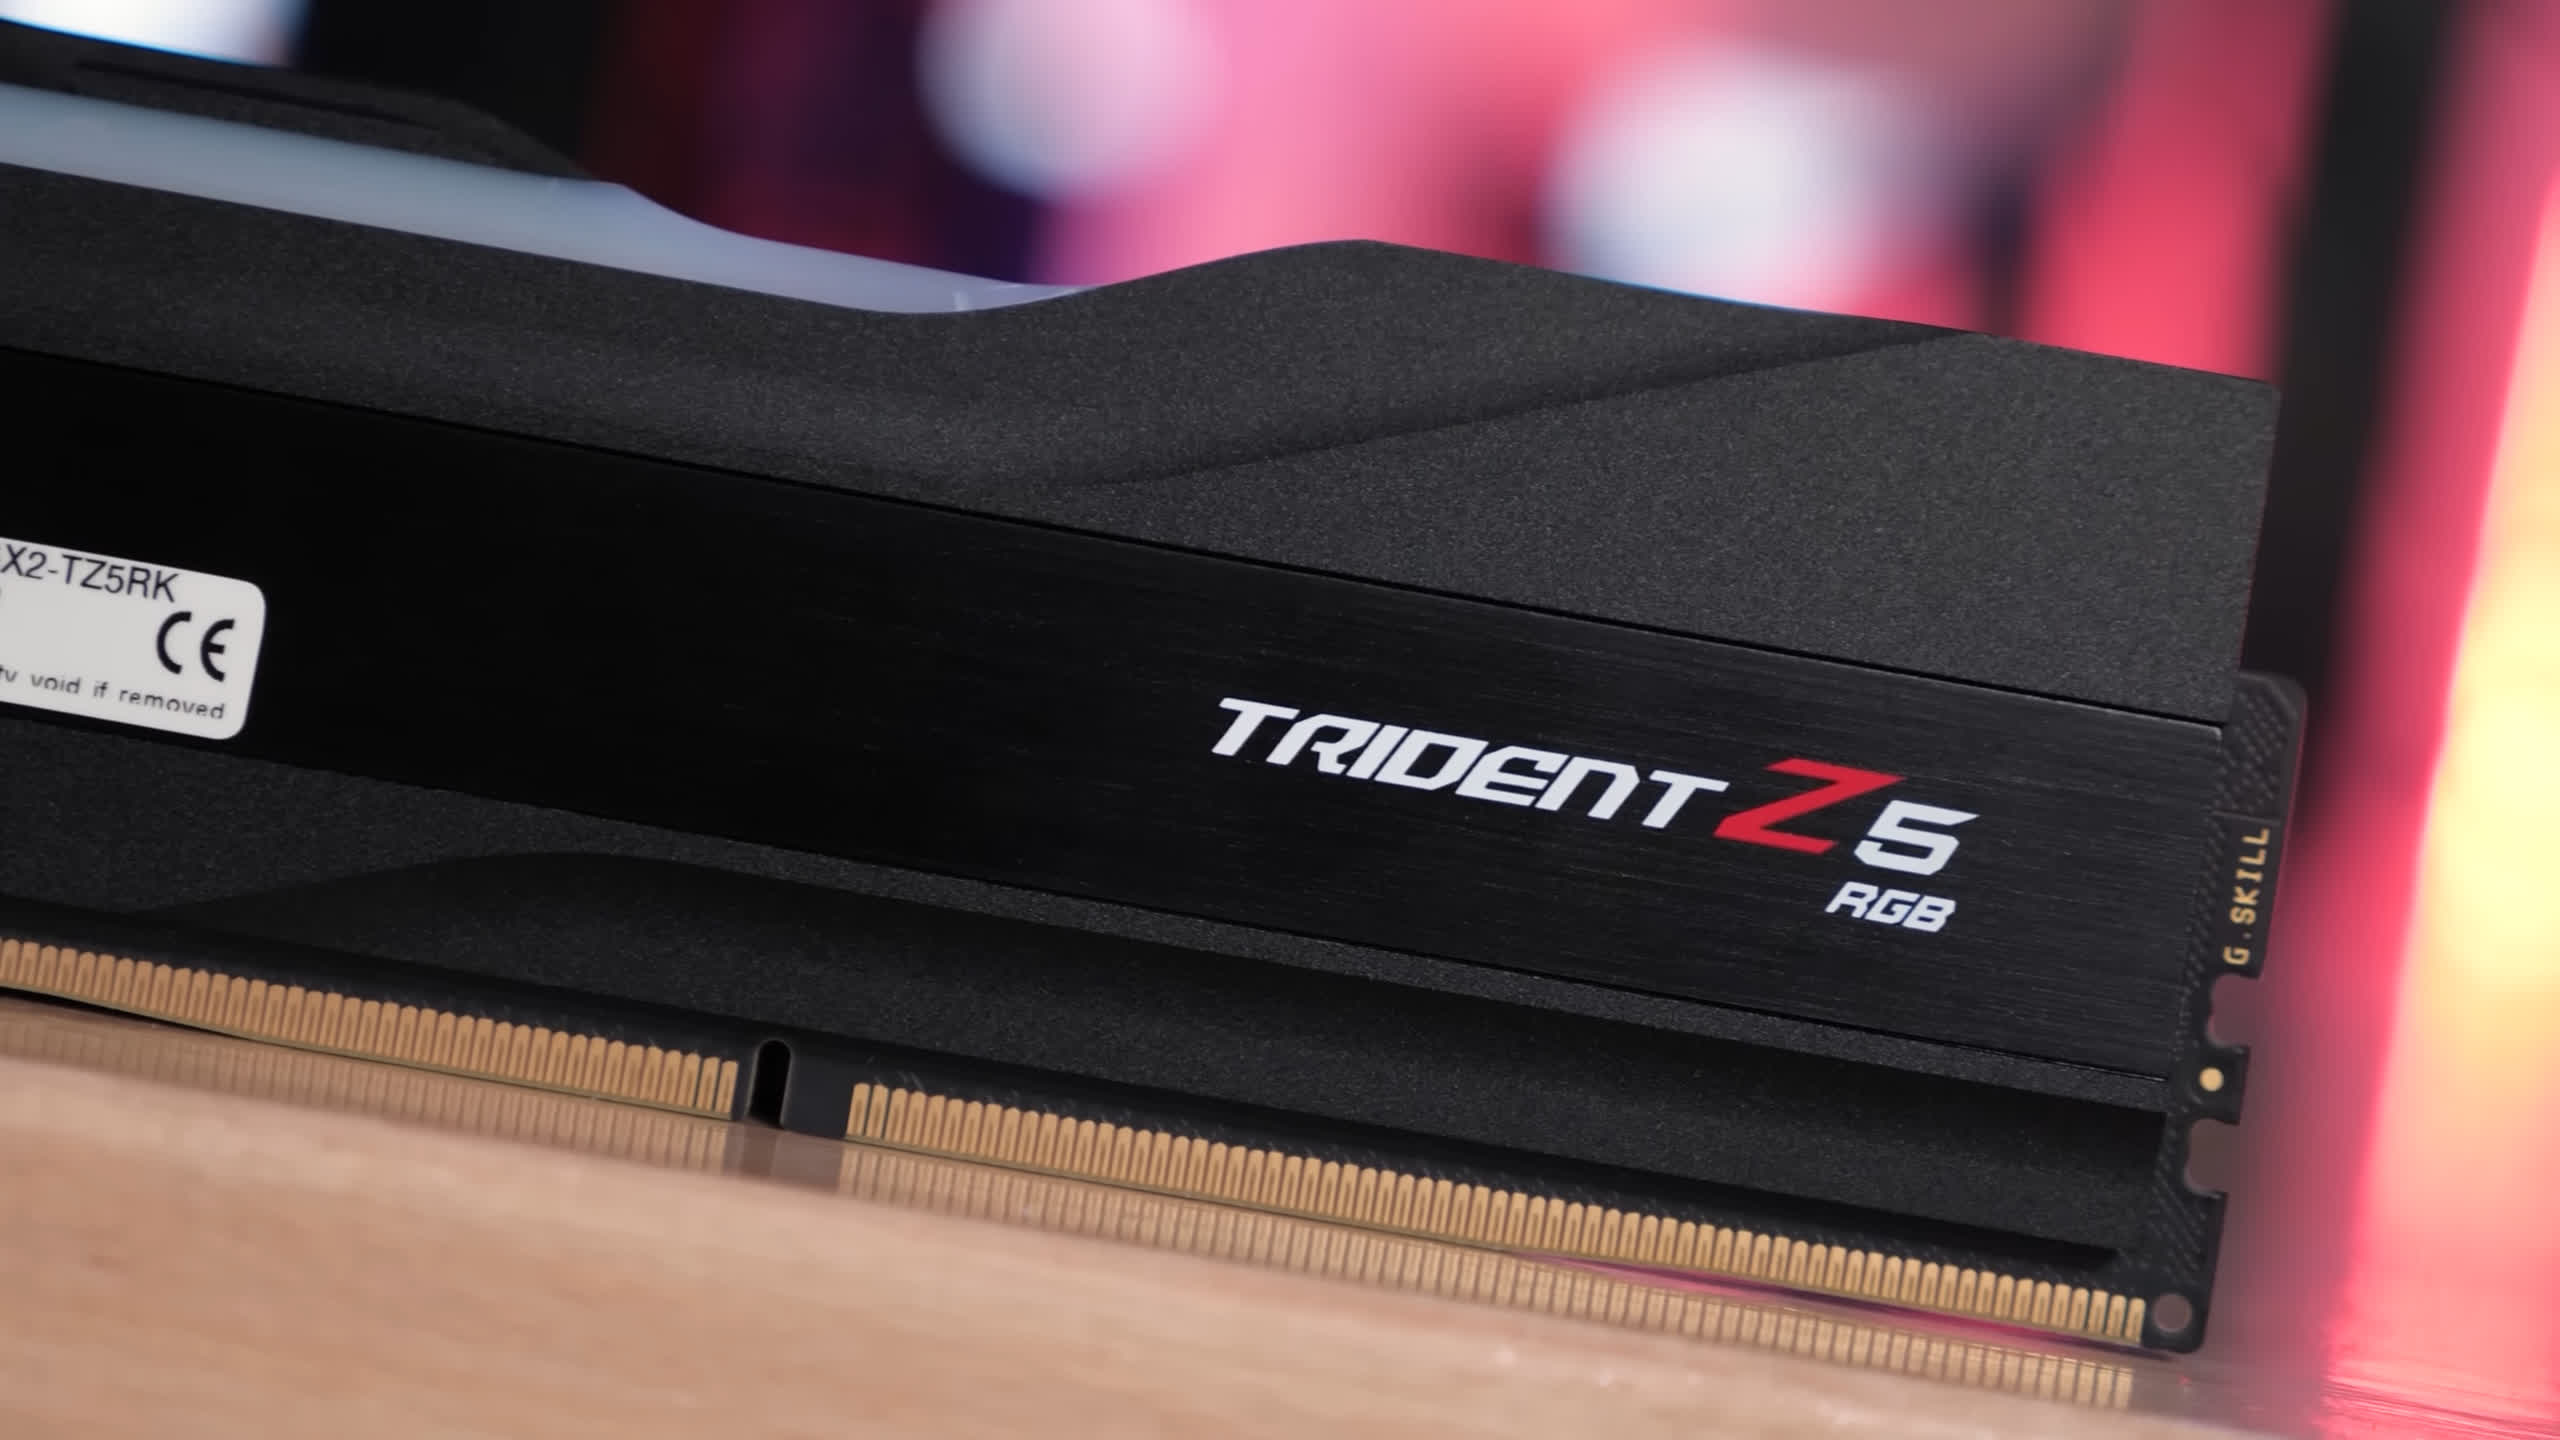
A decent AM4 B550 board is available for around $100, while comparable AM5 B650 boards range from $120-$140. Memory-wise, a DDR4-3600 CL16 kit costs $80-$90, while a DDR5-6000 CL32 kit costs $105. This results in a $40+ premium for the motherboard and memory when opting for the 7800X3D, making the total cost of the CPU, motherboard, and memory 35% higher at $675 compared to just $500 for the 5800X3D combo.
Of course, if you're already on the AM4 platform, using an older Zen, Zen+ or Zen 2 CPU, upgrading to the 5800X3D is a logical choice. It's incredibly affordable at around $300 and offers a significant performance upgrade for gamers. You could pay $320 or less for the 5800X3D and slot it into your existing system, or spend nearly $700 to replace your motherboard, memory, and CPU with the 7800X3D combo. Given what the 5800X3D offers, we believe upgrading to this part is the most reasonable for existing AM4 owners, which is why the processor is wildly popular.
For those requiring an entirely new gaming system, we believe extending the budget by around 35-40% for the 7800X3D combo is the better route. It may sound substantial, but in reality, it's less than $200, and for that, you get more immediate performance, a platform that can be upgraded in the future, and DDR5 support which should prove beneficial in many upcoming games.
The motherboard and memory costs are now so close that they don't significantly influence the purchasing decision. In our view, new system builders planning to spend $300 or more on their CPU should no longer consider AM4. Based on previous benchmarks, the Ryzen 7 7700, priced at $330, generally outperforms the 5800X3D. So, if not the 7800X3D, you should definitely consider the 7700 over the 5800X3D. We might add this CPU to our data set in the future.
Shopping Shortcuts:
- AMD Ryzen 9 7800X3D on Amazon
- AMD Ryzen 7 5800X3D on Amazon
- AMD Ryzen 9 7950X3D on Amazon
- AMD Ryzen 9 7950X on Amazon
- AMD Ryzen 7 7700 on Amazon
- Intel Core i7-13700K on Amazon
- Intel Core i5-13600K on Amazon
Further Testing
Since we published this review, we have run additional benchmarks and comparisons you may be interested in:
